
PUBLISHER: Mordor Intelligence | PRODUCT CODE: 2062174

PUBLISHER: Mordor Intelligence | PRODUCT CODE: 2062174
Reciprocating Compressors - Market Share Analysis, Industry Trends & Statistics, Growth Forecasts (2026 - 2031)
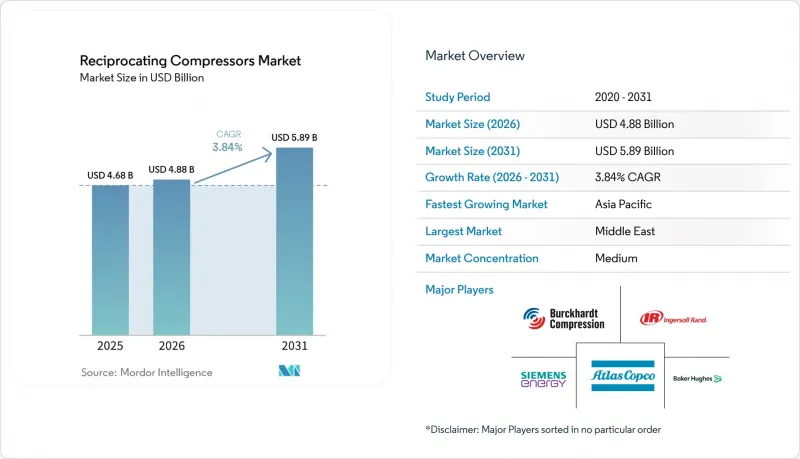
According to Mordor Intelligence, the reciprocating compressors market size is projected to expand from USD 4.68 billion in 2025 and USD 4.88 billion in 2026 to USD 5.89 billion by 2031, registering a 3.84% CAGR between 2026 to 2031.
This report is Segmented by Compressor Design (Horizontal Balanced-Opposed, Vertical In-Line, V-Type, Diaphragm, and Double-Acting), Lubrication (Oil-Lubricated, Oil-Free), Number of Stages (Single-Stage, Two-Stage, and Multi-Stage), End-User Industry (Oil and Gas, Chemicals and Petrochemicals, and More), and Geography. The Market Forecasts are Provided in Terms of Value (USD).
Global Reciprocating Compressors Market Trends and Insights
Renewed LNG Liquefaction Train Build-Out
Large-frame reciprocating packages are returning to favour for boil-off-gas reliquefaction and refrigerant duty as post-2025 final-investment decisions push new LNG trains forward. The February 2025 Saudi Aramco Jafurah Phase 3 award for six gas-compression trains underscores the commitment to oil-free, high-pressure machines in the Middle East. Burckhardt Compression soon followed with Laby 4K165-3 orders for Abu Dhabi's TA'ZIZ terminal, highlighting oil-free demand in cryogenic service. North Field East in Qatar and Gulf Coast expansions in the United States add a multiyear pipeline of orders exceeding 1,000 horsepower per unit. Owners increasingly specify electric-motor drives to meet greenhouse-gas targets, cutting methane slip inherent in gas-engine primaries. As supply chains strain, vendors that stock critical crankshafts and high-pressure valves secure pricing power.
Hydrogen Refuelling Infrastructure Build-Out
Mandated zero-emission truck corridors in Europe, California, Japan, and South Korea are scaling diaphragm and multi-stage reciprocating technology that can raise hydrogen from 200-500 bar storage to 350-700 bar dispensing. Siemens Energy's January 2026 contract for Hamburg's Green Hydrogen Hub typifies projects that need leak-tight, oil-free compression. Hoerbiger's HCP 500 diaphragm model extends service intervals to 8,000 hours by eliminating elastomer failure. Ariel has already shipped more than 150 hydrogen units up to 6,000 psig for refuelling and pipeline injection. Because centrifugal and screw machines lose efficiency at very high heads, reciprocating frames dominate this niche. The resulting order book is on course to outpace the broader reciprocating compressors market through 2031.
Capex Deferments in Deep-Water Projects Below USD 65 per Barrel
When Brent crude slips under USD 65 per barrel, operators freeze deepwater final-investment decisions, postponing compression packages for gas-lift, export, and vapor-recovery service. The International Energy Agency records a historic low in deepwater sanctions during prior downturns, highlighting macro exposure for OEM backlogs. Because floating production, storage, and offloading vessels need two to four years of engineering lead time, price weakness in 2026 would cascade into the late-2020s order funnel. Suppliers with onshore, petrochemical, and hydrogen exposure diversify risk.
Other drivers and restraints analyzed in the detailed report include:
- AI-Enabled Predictive Maintenance Unlocking 3-5 Point Uptime Gains
- Rise in Shale Gas Re-Fracturing Cycles
- Shift from Gas Lift to Electric Submersible Pumps in Mature Fields
For complete list of drivers and restraints, kindly check the Table Of Contents.
Segment Analysis
Horizontal balanced-opposed machines commanded 44.19% 2025 revenue, evidencing their suitability for gas gathering volumes above 283,000 m3 per day. The reciprocating compressors market share is unlikely to erode quickly because pipeline operators prize the low vibration and simplified foundation these frames deliver. In contrast, diaphragm units, though just a sliver of 2025 totals, are slated for a 4.58% CAGR as hydrogen retail stations proliferate. Hoerbiger's metal-diaphragm technology, rated 500 bars, removes permeation risks that plague elastomer membranes, expanding acceptance among fuel-cell vehicle corridors. V-type and in-line designs fill compact layouts in machine shops and small process units. Double-acting cylinders, still chosen for ammonia and methanol loops above 3,000 psig, illustrate why no single technology dominates every duty inside the reciprocating compressors market.
Diaphragm expansion is reinforced by stringent purity codes in pharmaceuticals and semiconductors, where ISO 8573-1 Class 0 air is mandatory. Asia-Pacific fabs scheduled for 2027 tape-out favour oil-free metal-diaphragm skids because screw or scroll machines struggle beyond 150 psig. Balanced-opposed OEMs counter with improved pulsation dampers and digital twins that cut commissioning time by 30%. As a result, the reciprocating compressors market size for balanced-opposed frames continues to inch forward even while faster niches steal headlines.
Oil-lubricated variants retained 63.63% volume in 2025, underpinning workshop air, midstream gas gathering, and LNG refrigeration where trace hydrocarbons are tolerated. Yet food, beverage, and electronics plants now budget premium pricing for Class 0 compliance, driving a 4.23% CAGR in oil-free reciprocating compressors. Burckhardt's labyrinth-piston Laby line avoids cross-contamination during ammonia reliquefication, while ELGi and CompAir promote PTFE ring kits that drop oil carryover below instrument-detectable limits. Because consumer-facing brands face product-recall penalties, the capital premium is justified.
Manufacturers also weigh life-cycle electricity costs. Oil-free stages deliver higher discharge temperatures, so many installations integrate intercooler heat recovery that trims net plant energy intensity. The reciprocating compressors market tracks these efficiency gains as brownfield refinery retrofits coincide with carbon-pricing schemes in Europe and California. Although oil-lubricated units will remain the backbone of upstream and midstream fleets for the forecast window, product roadmaps clearly arc toward dry-sealed technologies.
Geography Analysis
Asia-Pacific commanded 42.59% 2025 revenue on LNG terminal builds in India and Chinese coastal refinery upgrades. The region's governments add efficiency mandates India's Bureau of Energy Efficiency tightens compressor standards in 2026 that spur replacement of sub-standard units. Vietnam and Indonesia industrial growth drives workshop air sales, reinforcing baseline demand. The reciprocating compressors market size in Asia-Pacific remains buoyant as domestic OEMs localize production to skirt import duties.
North America held roughly 28% share, underpinned by shale gas re-fracturing and associated gas gathering. Supply-chain pinch points in crankshafts and valves elevate equipment lease rates, advantaging incumbents that carry inventory. The United States also pilot's hydrogen corridors from Texas to California, placing early orders for 700 bar diaphragm skids. Canada's LNG Canada Phase 2 and Woodfibre LNG add future upside.
Europe generated about 18% revenue in 2025 but contends with stringent noise rules under EU Directive 2000/14/EC that cap sound power and force low-speed designs. Retrofitting acoustic wraps and variable-speed drives helps legacy units stay compliant but raises unit cost. Meanwhile, the Middle East, forecast at a 4.44% CAGR, accelerates with Jafurah, TA'ZIZ, and Qatar's North Field East projects that bundle oil-free reciprocating compressors into blue-ammonia and hydrogen complexes. South America's pre-salt developments in Brazil and compression plants linked to Argentina's Vaca Muerta shale underpin incremental demand, while African growth hinges on deepwater discoveries off Namibia and Mozambique.
- Atlas Copco AB
- Ingersoll Rand Inc.
- Burckhardt Compression AG
- Baker Hughes Company
- Siemens Energy AG
- Elliott Group (Ebara Corporation)
- Howden Group Ltd. (Chart Industries)
- Ariel Corporation
- Hitachi Ltd.
- Kobe Steel Ltd.
- Shenyang Blower Works Group Co. Ltd.
- Kirloskar Pneumatic Company Ltd.
- Mitsui E&S Machinery Co. Ltd.
- Sundyne LLC
- Mayekawa Mfg. Co., Ltd.
- Kaeser Kompressoren SE
- Hanwha Power Systems Co. Ltd.
- Shanghai Screw Compressor Co. Ltd.
- Enerflex Ltd.
- MAN Energy Solutions SE
Additional Benefits:
- The market estimate (ME) sheet in Excel format
- 3 months of analyst support
TABLE OF CONTENTS
1 INTRODUCTION
- 1.1 Study Assumptions and Market Definition
- 1.2 Scope of the Study
2 RESEARCH METHODOLOGY
3 EXECUTIVE SUMMARY
4 MARKET LANDSCAPE
- 4.1 Market Overview
- 4.2 Market Drivers
- 4.2.1 Renewed LNG Liquefaction Train Build-Out (Post-2025 FIDs)
- 4.2.2 Hydrogen Refuelling Infrastructure Build-Out
- 4.2.3 Rise in Shale Gas Re-Fracturing Cycles (North America)
- 4.2.4 Mandatory Energy-Efficiency Retrofits in Brown-Field Refineries
- 4.2.5 AI-Enabled Predictive Maintenance Unlocking 3-5 pp Uptime Gains
- 4.2.6 OEM Shift to Modular Skid-Mounted Packages for Offshore FPSOs
- 4.3 Market Restraints
- 4.3.1 Capex Deferments in Deep-Water Projects Below USD 65 bbl
- 4.3.2 Shift from Gas Lift to Electric Submersible Pumps in Mature Fields
- 4.3.3 Industrial Move Toward Oil-Free Screw Units in Food and Pharma
- 4.3.4 Stringent Urban Noise Codes Greater Than 75 dB-A Curbing Inner-City Installations
- 4.4 Industry Supply-Chain Analysis
- 4.5 Regulatory Landscape
- 4.6 Technological Outlook
- 4.7 Porter's Five Forces Analysis
- 4.7.1 Threat of New Entrants
- 4.7.2 Bargaining Power of Suppliers
- 4.7.3 Bargaining Power of Buyers
- 4.7.4 Threat of Substitute Products
- 4.7.5 Intensity of Competitive Rivalry
- 4.8 Impact of Macroeconomic Factors on the Market
5 MARKET SIZE AND GROWTH FORECASTS (VALUE)
- 5.1 By Compressor Design
- 5.1.1 Horizontal Balanced-Opposed
- 5.1.2 Vertical In-Line
- 5.1.3 V-Type
- 5.1.4 Diaphragm
- 5.1.5 Double-Acting
- 5.2 By Lubrication
- 5.2.1 Oil-Lubricated
- 5.2.2 Oil-Free
- 5.3 By Number of Stages
- 5.3.1 Single-Stage
- 5.3.2 Two-Stage
- 5.3.3 Multi-Stage
- 5.4 By End-User Industry
- 5.4.1 Oil and Gas
- 5.4.2 Chemicals and Petrochemicals
- 5.4.3 Power Generation
- 5.4.4 Manufacturing and Industrial
- 5.4.5 HVAC and Refrigeration
- 5.4.6 Others End-User Industry (Healthcare, Food and Beverage)
- 5.5 By Geography
- 5.5.1 North America
- 5.5.1.1 United States
- 5.5.1.2 Canada
- 5.5.1.3 Mexico
- 5.5.2 South America
- 5.5.2.1 Brazil
- 5.5.2.2 Argentina
- 5.5.2.3 Rest of South America
- 5.5.3 Europe
- 5.5.3.1 Germany
- 5.5.3.2 France
- 5.5.3.3 United Kingdom
- 5.5.3.4 Italy
- 5.5.3.5 Spain
- 5.5.3.6 Rest of Europe
- 5.5.4 Asia-Pacific
- 5.5.4.1 China
- 5.5.4.2 India
- 5.5.4.3 Japan
- 5.5.4.4 South Korea
- 5.5.4.5 Rest of Asia-Pacific
- 5.5.5 Middle East and Africa
- 5.5.5.1 Middle East
- 5.5.5.1.1 Saudi Arabia
- 5.5.5.1.2 United Arab Emirates
- 5.5.5.1.3 Rest of Middle East
- 5.5.5.2 Africa
- 5.5.5.2.1 South Africa
- 5.5.5.2.2 Rest of Africa
- 5.5.5.1 Middle East
- 5.5.1 North America
6 COMPETITIVE LANDSCAPE
- 6.1 Market Concentration
- 6.2 Strategic Moves
- 6.3 Market Share Analysis
- 6.4 Company Profiles (includes Global Level Overview, Market Level Overview, Core Segments, Financials as available, Strategic Information, Market Rank/Share, Products and Services, Recent Developments)
- 6.4.1 Atlas Copco AB
- 6.4.2 Ingersoll Rand Inc.
- 6.4.3 Burckhardt Compression AG
- 6.4.4 Baker Hughes Company
- 6.4.5 Siemens Energy AG
- 6.4.6 Elliott Group (Ebara Corporation)
- 6.4.7 Howden Group Ltd. (Chart Industries)
- 6.4.8 Ariel Corporation
- 6.4.9 Hitachi Ltd.
- 6.4.10 Kobe Steel Ltd.
- 6.4.11 Shenyang Blower Works Group Co. Ltd.
- 6.4.12 Kirloskar Pneumatic Company Ltd.
- 6.4.13 Mitsui E&S Machinery Co. Ltd.
- 6.4.14 Sundyne LLC
- 6.4.15 Mayekawa Mfg. Co., Ltd.
- 6.4.16 Kaeser Kompressoren SE
- 6.4.17 Hanwha Power Systems Co. Ltd.
- 6.4.18 Shanghai Screw Compressor Co. Ltd.
- 6.4.19 Enerflex Ltd.
- 6.4.20 MAN Energy Solutions SE
7 MARKET OPPORTUNITIES AND FUTURE OUTLOOK
- 7.1 White-Space and Unmet-Need Assessment

