
PUBLISHER: Mordor Intelligence | PRODUCT CODE: 2062246

PUBLISHER: Mordor Intelligence | PRODUCT CODE: 2062246
Pharmaceutical Solvents - Market Share Analysis, Industry Trends & Statistics, Growth Forecasts (2026 - 2031)
According to Mordor Intelligence, the pharmaceutical solvents market size is expected to grow from USD 5.67 billion in 2025 to USD 5.96 billion in 2026 and is forecast to reach USD 7.65 billion by 2031 at 5.13% CAGR over 2026-2031.
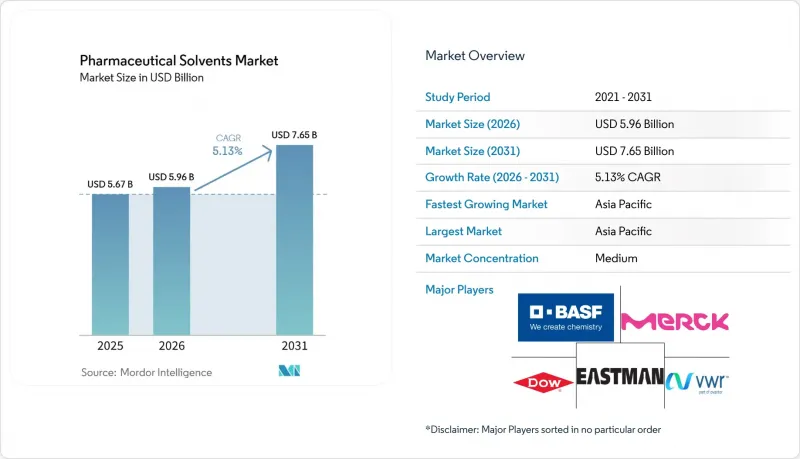
This report is Segmented by Type (Alcohols, Glycols, Ethers, and More), Function (Reaction Medium, Extraction Solvent, Purification/Crystallization, and More), Application (API Manufacturing, Formulations, Drug-Delivery Systems, and More), and Geography (Asia-Pacific, North America, Europe, South America, and the Middle East and Africa). The Market Forecasts are Provided in Terms of Value (USD).
Global Pharmaceutical Solvents Market Trends and Insights
Growing Pharmaceutical Production and R&D Spending
Global drug output eased from 9.1% growth in 2025 to a still-solid 1.6% pace in 2026, yet biologics remain in double-digit expansion, lifting per-batch solvent intensity because monoclonal antibodies require multi-stage chromatography that consumes high-purity acetonitrile and methanol. Asia's share of Phase III trials now exceeds one-third of global totals, steering incremental solvent orders toward Chinese and Indian suppliers that have upgraded fractional-distillation lines to pharmacopeia standards.
Increasing Demand for Ultra-High-Purity Solvents in Biologics and HPAPI Manufacturing
Biologics fill-finish suites specify low-endotoxin grades, and closed-system transfers eliminate opportunities for on-site recovery. Merck's EUR 300 million (USD 346.5 million) bioprocessing hub in Daejeon is positioned to supply just-in-time volumes of sterile THF and dimethylformamide to vaccine makers.
Stringent VOC and Residual-Solvent Regulations
ICH Q3C and USP 467 impose ppm-level caps on residual solvents, forcing reformulation away from methylene chloride and chloroform. Europe's REACH fees reach EUR 500,000 (USD 575,930) per substance and are nudging formulators toward lower-toxicity esters and bio-alcohols.
Other drivers and restraints analyzed in the detailed report include:
- Expanding Generic and Contract Manufacturing Capacity in Emerging Economies
- Adoption of Continuous-Flow and Solvent-Recycling Technologies
- Petro-Feedstock Price Volatility
For complete list of drivers and restraints, kindly check the Table Of Contents.
Segment Analysis
Alcohols held 45.45% of 2025 revenue. Within the pharmaceutical solvents market size, isopropanol consumption alone topped multiple million metric tons, propelled by sanitizer, API, and lyophilization demand. Glycols and ethers fill niche roles but face toxicity scrutiny, while chlorinated solvents keep retreating under regulatory pressure. Other Types, ionic liquids, supercritical CO2, bio-based alcohols, are on a 5.80% CAGR trajectory, reflecting green-chemistry incentives and continuous-flow compatibility. Despite limited installed capacity, early adopters value the improved selectivity and lower VOC profile that these alternatives deliver, positioning them as strategic growth nodes in the pharmaceutical solvents market.
The competitive response centers on capacity upgrades to handle pharmacopeia-grade purification. BASF's 290,000 tons per annum THF Pharma complex is now paired with a Michigan GMP (Good Manufacturing Practice) Solution Center that offers on-site blending support. Japanese producers focus on renewable feedstocks; Mitsui's bio-isopropanol plant underscores a move toward circular-carbon products. As supply chains diversify, traditional aromatics lose share, a trend amplified by tariffs that erode export economics into key demand centers.
Geography Analysis
Asia-Pacific captured 38.56% of 2025 revenue and is forecast to grow at 6.02% CAGR through 2031. Chinese CDMOs keep adding stainless-steel fermenters, while India's FDA-approved sites exceed 750, securing a floor for commodity alcohol consumption. South Korea's USD 4.8 billion third bio-campus further tightens downstream demand for USP-grade THF and acetonitrile. A two-tier supply structure is emerging: multinationals import ultra-high-purity grades, whereas domestic generic firms buy competitively priced local alcohols.
North America ranks second. U.S. consumption of USP-grade isopropanol topped 870,000 tons last year, and BASF's Michigan GMP center plus ExxonMobil's Louisiana expansion demonstrate a clear localization push. Foreign investors like Celltrion are acquiring U.S. plants to navigate tariff complexity, ensuring solvent off-take stays domestic.
Europe's share is pressured by energy prices and REACH fees, yet the bloc remains a specialist hub for high-value APIs. Dow, LyondellBasell, and Sabic closed crackers, tightening olefin supply. Survivors such as INEOS now market low-VOC, pharmaceutical-grade isopropanol aligned with the EU Safe and Sustainable by Design program. Outside the big three regions, Latin America and the Middle East grow from a lower base, with Brazil and Saudi Arabia pursuing upstream integration that may localize solvent capacity over the next decade.
- Avantor, Inc.
- BASF
- Clariant AG
- Dow Inc.
- Eastman Chemical Company
- Evonik Industries AG
- Exxon Mobil Corporation
- Huntsman Corporation
- INEOS Group
- LyondellBasell Industries
- Merck KGaA
- Mitsubishi Chemical Group
- Sasol
- Solvay S.A.
- Thermo Fisher Scientific Inc.
Additional Benefits:
- The market estimate (ME) sheet in Excel format
- 3 months of analyst support
TABLE OF CONTENTS
1 Introduction
- 1.1 Study Assumptions and Market Definition
- 1.2 Scope of the Study
2 Research Methodology
3 Executive Summary
4 Market Landscape
- 4.1 Market Overview
- 4.2 Market Drivers
- 4.2.1 Growing pharmaceutical production and RandD spending
- 4.2.2 Increasing demand for ultra-high-purity solvents in biologics and HPAPI manufacturing
- 4.2.3 Expanding generic and contract manufacturing capacity in emerging economies
- 4.2.4 Adoption of continuous-flow and solvent-recycling technologies
- 4.2.5 Digital solvent-selection platforms shortening formulation cycles
- 4.2.6 Regulatory push for pharmacopeia-grade bio-based solvents
- 4.3 Market Restraints
- 4.3.1 Stringent VOC and residual-solvent regulations
- 4.3.2 Petro-feedstock price volatility
- 4.3.3 Rise of solvent-free/solid-state synthesis routes
- 4.3.4 High capex for on-site GMP solvent recovery systems
- 4.4 Value Chain Analysis
- 4.5 Porter's Five Forces
- 4.5.1 Threat of New Entrants
- 4.5.2 Bargaining Power of Buyers
- 4.5.3 Bargaining Power of Suppliers
- 4.5.4 Threat of Substitutes
- 4.5.5 Competitive Rivalry
5 Market Size and Growth Forecasts (Value)
- 5.1 By Type
- 5.1.1 Alcohols (Ethanol, Isopropanol, Butanol, etc.)
- 5.1.2 Glycols (Propylene, Ethylene)
- 5.1.3 Ethers (Diethyl Ether, THF)
- 5.1.4 Esters (Ethyl, Butyl Acetate)
- 5.1.5 Chlorinated Solvents (Methylene Chloride, Chloroform)
- 5.1.6 Aromatic Hydrocarbons (Toluene, Xylene)
- 5.1.7 Ketones (Acetone, MEK)
- 5.1.8 Other Types (Alkanes, Super-critical Fluids, Ionic Liquids)
- 5.2 By Function
- 5.2.1 Reaction Medium
- 5.2.2 Extraction Solvent
- 5.2.3 Purification/Crystallization
- 5.2.4 Formulation and Blending Agent
- 5.3 By Application
- 5.3.1 API Manufacturing
- 5.3.2 Formulations (Oral, Injectable, Topical)
- 5.3.3 Drug-Delivery Systems
- 5.3.4 Biopharmaceutical Production
- 5.3.5 Analytical and QC Laboratories
- 5.3.6 Other Applications (Cleaning, Sterilization, Packaging)
- 5.4 By Geography
- 5.4.1 Asia-Pacific
- 5.4.1.1 China
- 5.4.1.2 Japan
- 5.4.1.3 India
- 5.4.1.4 South Korea
- 5.4.1.5 ASEAN Countries
- 5.4.1.6 Rest of Asia-Pacific
- 5.4.2 North America
- 5.4.2.1 United States
- 5.4.2.2 Canada
- 5.4.2.3 Mexico
- 5.4.3 Europe
- 5.4.3.1 Germany
- 5.4.3.2 United Kingdom
- 5.4.3.3 France
- 5.4.3.4 Italy
- 5.4.3.5 Spain
- 5.4.3.6 Russia
- 5.4.3.7 Rest of Europe
- 5.4.4 South America
- 5.4.4.1 Brazil
- 5.4.4.2 Argentina
- 5.4.4.3 Rest of South America
- 5.4.5 Middle East and Africa
- 5.4.5.1 Saudi Arabia
- 5.4.5.2 South Africa
- 5.4.5.3 Rest of Middle East and Africa
- 5.4.1 Asia-Pacific
6 Competitive Landscape
- 6.1 Market Concentration
- 6.2 Strategic Moves
- 6.3 Market Share(%)/Ranking Analysis
- 6.4 Company Profiles (includes Global level Overview, Market level overview, Core Segments, Financials as available, Strategic Information, Products and Services, and Recent Developments)
- 6.4.1 Avantor, Inc.
- 6.4.2 BASF
- 6.4.3 Clariant AG
- 6.4.4 Dow Inc.
- 6.4.5 Eastman Chemical Company
- 6.4.6 Evonik Industries AG
- 6.4.7 Exxon Mobil Corporation
- 6.4.8 Huntsman Corporation
- 6.4.9 INEOS Group
- 6.4.10 LyondellBasell Industries
- 6.4.11 Merck KGaA
- 6.4.12 Mitsubishi Chemical Group
- 6.4.13 Sasol
- 6.4.14 Solvay S.A.
- 6.4.15 Thermo Fisher Scientific Inc.
7 Market Opportunities and Future Outlook
- 7.1 White-space and Unmet-Need Assessment

