
PUBLISHER: Mordor Intelligence | PRODUCT CODE: 2062252

PUBLISHER: Mordor Intelligence | PRODUCT CODE: 2062252
Polycarboxylate Ether - Market Share Analysis, Industry Trends & Statistics, Growth Forecasts (2026 - 2031)
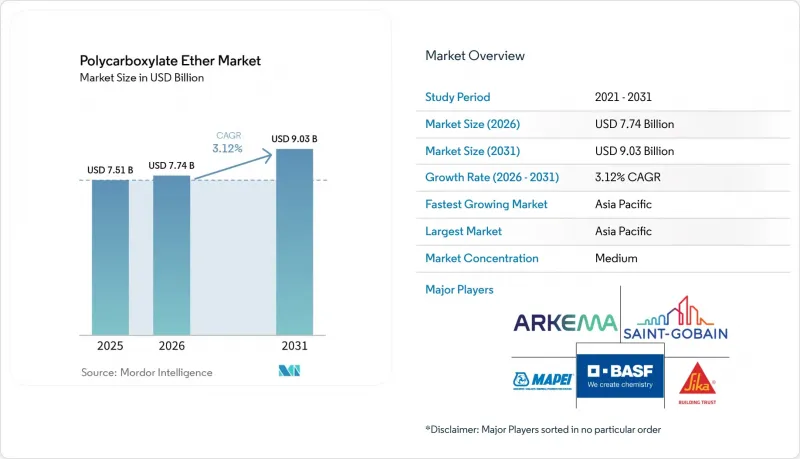
According to Mordor Intelligence, the polycarboxylate ether market size is projected to expand from USD 7.51 billion in 2025 and USD 7.74 billion in 2026 to USD 9.03 billion by 2031, registering a CAGR of 3.12% between 2026 and 2031.
This report is Segmented by Type (MPEG-Based, TPEG-Based, and More), Form (Liquid and Powder), Application (Ready-Mix Concrete, High-Performance Concrete, and More), End-User Industry (Residential Construction, Commercial Construction, and More), and Geography (Asia-Pacific, North America, Europe, South America, and Middle East and Africa). The Market Forecasts are Provided in Terms of Value (USD).
Global Polycarboxylate Ether Market Trends and Insights
Rapid Infrastructure Investment Across Asia-Pacific and Africa
South Asia, Southeast Asia, and Africa together earmarked more than USD 250 billion for transport corridors, power grids, and water projects slated for 2026-2028; the Asian Development Bank alone allocated USD 98.6 billion for that window. Funds are channeling toward concrete used in bridges, highways, and metro systems, where long-haul pumping favors TPEG-based chemistries thanks to 120-minute slump retention. Africa's annual infrastructure gap of roughly USD 170 billion is stimulating demand for powder-grade admixtures that cut freight volumes by 70%, a decisive cost advantage on landlocked routes. These capital programs collectively lift the Polycarboxylate Ether market by an estimated 1.2 percentage-point CAGR contribution through 2031.
Tightening Water-Cement-Ratio Rules in Green Building Codes
Municipal ordinances in Berkeley, California, cap water-cement ratios below 0.40 for projects above 5,000 ft2, effectively mandating high-range water reducers such as Polycarboxylate Ether products to maintain workability. The EU's Environmental Product Declaration scheme grants life-cycle-carbon credits for mixes that substitute 15-20% cement with supplementary materials, a target difficult to reach without advanced superplasticizers. LEED v5 and BREEAM 2024 now award extra points to slabs achieving the same sub-0.40 ratio, reinforcing a structural pull through 2031.
Environmental Scrutiny of Non-Biodegradable Polymer Residues
The European Union (EU) microplastics restriction 2023/2055 forces admixture producers to document degradation paths for polyethylene-oxide side chains; a 2028 review could rescind current construction exemptions. The U.S. EPA's updated Toxic Substances Control Act inventory likewise obliges manufacturers to disclose molecular-weight distributions, adding USD 50,000-100,000 compliance cost per formulation. These pressures accelerate research into lignin-based alternatives that deliver 28-32 % water reduction yet command 20-25 % higher cost.
Other drivers and restraints analyzed in the detailed report include:
- Expansion of RMC Batching Plants in Tier-2 Cities
- 3D-Printed Concrete Needs Rheology-Tuned Super-Plasticizers
- Patent Thickets Around Comb-Polymer Architectures
For complete list of drivers and restraints, kindly check the Table Of Contents.
Segment Analysis
MPEG held 41.14% Polycarboxylate Ether market share in 2025 because its cost sits 20-25% below TPEG. TPEG, however, is forecast for a 3.26% CAGR during the forecast period (2026-2031) owing to 120-minute slump retention in 35-45°C pours, essential for remote infrastructure segments. The Polycarboxylate Ether market size for TPEG-based grades could rise by 2031 if current specifications persist, while APEG remains niche for precast. BASF's May 2025 boost in Pluriol A2400I capacity confirms accelerating TPEG demand.
Regional preferences diverge: Middle East megaprojects overwhelmingly specify TPEG, China's tier-2 builders substitute MPEG to win bids, and Europe is slowly pivoting toward TPEG as infrastructure specs lengthen transport windows. Emerging lignin-based and phosphonate-modified types are expected to have a minimal share by 2031, owing to feedstock and process bottlenecks, but may command premium pricing where bio-based or clay-tolerant credentials are mandated.
Liquid products dominated 74.56% of the Polycarboxylate Ether market size in 2025 due to plug-and-play batching. Powder forms, though, are anticipated to grow at 3.78% CAGR during the forecast period (2026-2031), taking share in Africa, the Middle East, and Central Asia, where freight savings exceed 40% on long ocean-plus-road voyages. A shift of even five percentage points toward powder could lift its revenue contribution substantially by 2031.
Dissolution times have shrunk below three minutes through spray-drying advances, removing the chief operational barrier for high-throughput plants. In Europe and North America, powder-grade uptake in dry-mix mortars and self-leveling compounds supports just-in-time prefabrication strategies, solidifying a premium sub-segment that sells at 10-15% price lifts over liquid equivalents.
Geography Analysis
Asia-Pacific commanded 45.25% of the Polycarboxylate Ether market share in 2025 and should sustain a 3.79% CAGR to 2031. India's Polycarboxylate Ether market is buoyed by a ready-mix expansion, with new batching plants in Nagpur, Ranchi, Raipur, and Gandhinagar driving uptake. Conversely, China's 45% residential downturn curtailed polymer demand in top-tier metros, though a CNY 1 trillion infrastructure stimulus preserved concrete production at 2.4 billion m3 in 2024. Southeast Asian nations executing the ASEAN Connectivity master-plan corridors increased Polycarboxylate Ether market penetration in ready-mix to roughly 60% by 2026.
North America's share in 2025 was strengthened by the USD 550 billion Infrastructure Investment and Jobs Act, which is channeling funds to bridges and broadband foundations requiring high-performance concrete. The region's hyperscale data-center boom is another accelerant: more than 40 sites broke ground in 2025 alone, each specifying ultra-low-shrinkage mixes. Sika's December 2025 automated plant in Florida demonstrates local capacity buildup to meet Southeastern U.S. demand.
Europe's market share reflects recovery from the 2023-2024 slump; Germany and France resumed stalled urban-mobility projects, while Eastern Europe leverages EU Cohesion Funds for transport upgrades. BASF's Pluriol A2400I expansion provides regional feedstock security for TPEG-based grades amid stricter EPD rules. The Middle East & Africa and South America exhibit above-average growth. Saudi Arabia and the UAE specify TPEG polymers for mega-projects facing 45°C site temperatures, whereas South Africa's ZAR 1 trillion (USD 59.4 billion) infrastructure pipeline uses powder grades to sidestep long-haul liquid shipping costs. Brazil's market is rebounding as Sika extends admixture output to serve mining and ready-mix clients.
- Arkema
- BASF
- Chembond Chemicals Limited
- CICO Group
- Dow
- Enaspol a.s.
- Fosroc, Inc.
- Ha-Be Betonchemie GmbH
- Kao Chemicals Europe, S.L.U.
- LOTTE Fine Chemical CO,.Ltd.
- MAPEI S.p.A.
- MUHU (China) Construction Materials Co., Ltd.
- Saint-Gobain
- Sika AG
- Sobute New Materials Co., Ltd.
Additional Benefits:
- The market estimate (ME) sheet in Excel format
- 3 months of analyst support
TABLE OF CONTENTS
1 Introduction
- 1.1 Study Assumptions and Market Definition
- 1.2 Scope of the Study
2 Research Methodology
3 Executive Summary
4 Market Landscape
- 4.1 Market Overview
- 4.2 Market Drivers
- 4.2.1 Rapid infrastructure investment across Asia-Pacific and Africa
- 4.2.2 Tightening water-cement-ratio rules in green building codes
- 4.2.3 Expansion of RMC batching plants in tier-2 cities
- 4.2.4 3D-printed concrete needs rheology-tuned super-plasticizers
- 4.2.5 Liquid-cooled data-center slabs demand ultra-low-shrinkage mixes
- 4.3 Market Restraints
- 4.3.1 Environmental scrutiny of non-biodegradable polymer residues
- 4.3.2 Patent thickets around comb-polymer architectures
- 4.3.3 Rise of LC3 and geopolymer concrete reducing PCE dosage
- 4.4 Value Chain Analysis
- 4.5 Porter's Five Forces Analysis
- 4.5.1 Bargaining Power of Suppliers
- 4.5.2 Bargaining Power of Buyers
- 4.5.3 Threat of New Entrants
- 4.5.4 Threat of Substitutes
- 4.5.5 Competitive Rivalry
5 Market Size and Growth Forecasts (Value)
- 5.1 By Type
- 5.1.1 MPEG-Based
- 5.1.2 APEG-Based
- 5.1.3 TPEG-Based
- 5.1.4 Others
- 5.2 By Form
- 5.2.1 Liquid
- 5.2.2 Powder
- 5.3 By Application
- 5.3.1 Ready-Mix Concrete (RMC)
- 5.3.2 Precast Concrete
- 5.3.3 High-Performance Concrete
- 5.3.4 Self-Compacting Concrete
- 5.3.5 Others
- 5.4 By End-user Industry
- 5.4.1 Residential Construction
- 5.4.2 Commercial Construction
- 5.4.3 Infrastructure Projects
- 5.5 By Geography
- 5.5.1 Asia-Pacific
- 5.5.1.1 China
- 5.5.1.2 India
- 5.5.1.3 Japan
- 5.5.1.4 South Korea
- 5.5.1.5 ASEAN Countries
- 5.5.1.6 Rest of Asia-Pacific
- 5.5.2 North America
- 5.5.2.1 United States
- 5.5.2.2 Canada
- 5.5.2.3 Mexico
- 5.5.3 Europe
- 5.5.3.1 Germany
- 5.5.3.2 United Kingdom
- 5.5.3.3 France
- 5.5.3.4 Italy
- 5.5.3.5 Russia
- 5.5.3.6 NORDIC Countries
- 5.5.3.7 Rest of Europe
- 5.5.4 South America
- 5.5.4.1 Brazil
- 5.5.4.2 Argentina
- 5.5.4.3 Rest of South America
- 5.5.5 Middle-East and Africa
- 5.5.5.1 Saudi Arabia
- 5.5.5.2 South Africa
- 5.5.5.3 Rest of Middle-East and Africa
- 5.5.1 Asia-Pacific
6 Competitive Landscape
- 6.1 Market Concentration
- 6.2 Strategic Moves
- 6.3 Market Share(%)/Ranking Analysis
- 6.4 Company Profiles (includes Global Overview, Market Overview, Core Segments, Financials, Strategic Information, Products and Services, and Recent Developments)
- 6.4.1 Arkema
- 6.4.2 BASF
- 6.4.3 Chembond Chemicals Limited
- 6.4.4 CICO Group
- 6.4.5 Dow
- 6.4.6 Enaspol a.s.
- 6.4.7 Fosroc, Inc.
- 6.4.8 Ha-Be Betonchemie GmbH
- 6.4.9 Kao Chemicals Europe, S.L.U.
- 6.4.10 LOTTE Fine Chemical CO,.Ltd.
- 6.4.11 MAPEI S.p.A.
- 6.4.12 MUHU (China) Construction Materials Co., Ltd.
- 6.4.13 Saint-Gobain
- 6.4.14 Sika AG
- 6.4.15 Sobute New Materials Co., Ltd.
7 Market Opportunities and Future Outlook
- 7.1 White-space and Unmet-need Assessment

