
PUBLISHER: Mordor Intelligence | PRODUCT CODE: 2062356

PUBLISHER: Mordor Intelligence | PRODUCT CODE: 2062356
Thermally Conductive Filler Dispersants - Market Share Analysis, Industry Trends & Statistics, Growth Forecasts (2026 - 2031)
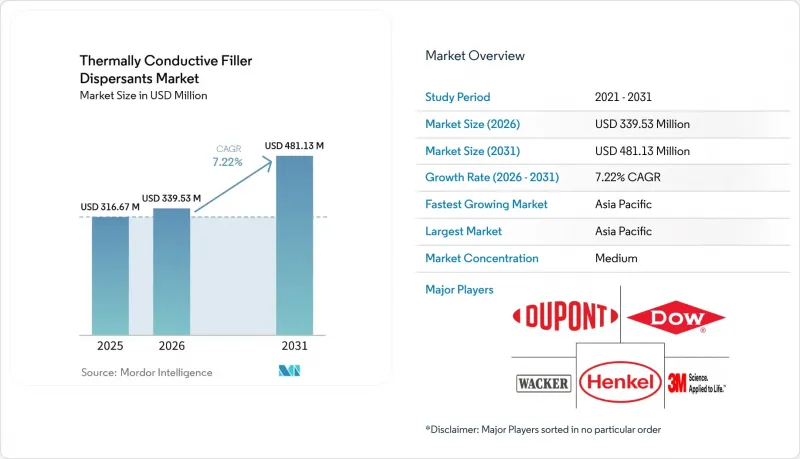
According to Mordor Intelligence, the thermally conductive filler dispersants market size was valued at USD 316.67 million in 2025 and is estimated to grow from USD 339.53 million in 2026 to reach USD 481.13 million by 2031, at a CAGR of 7.22% during the forecast period (2026-2031).
This report is Segmented by Filler Type (Boron Nitride, Aluminum Oxide, and More), Formulation (Liquid Dispersions, and More), Application (Thermal Interface Materials (TIMs), Electrically-Insulating Compounds, and More), End-User Industry (Electronics, and More), and Geography (Asia-Pacific, North America, and More). The Market Forecasts are Provided in Terms of Value (USD).
Global Thermally Conductive Filler Dispersants Market Trends and Insights
Surge in EV Battery and Power-Module Heat-Flux Density
Liquid and immersion cooling are now dominant in 300 Wh/kg battery packs, where local heat fluxes exceed 50 W/cm2 at cell tabs. To maintain 5 W/m*K bond lines within 0.3 mm gaps, products like Evonik's ORTEGOL DA 801 and DuPont's BETAMATE 2090 utilize polyurethane-compatible dispersants that accommodate +-0.2 mm z-axis expansion while eliminating the need for energy-intensive oven curing. Chinese integrators, such as Shenzhen Feirongda, collaborate with CATL to co-design vapor-chamber assemblies, embedding dispersants within complete thermal modules to capture margins. However, as immersion cooling becomes more widespread, residual ionic impurities above 10 ppm remain a challenge, as they reduce dielectric-fluid resistivity below 1 GΩ*cm, prompting a shift toward ultrapure filler grades.
Semiconductor Node-Shrink Driven Hotspot Management
3D-stacked high-bandwidth memory and 200 W CPUs introduce up to four TIM interfaces per package, increasing thermal resistance by 0.15 K cm2/W per layer unless sub-50 nm filler spacing is maintained. Henkel's Bergquist TLF 6500 CGel-SF and Infineon's indium-alloy attach guidelines require dispersants that stabilize 85 vol% ceramic loadings within 25 µm bond lines while preventing sedimentation at 180 °C reflow temperatures. These advancements in packaging are expected to create an incremental addressable market of USD 85 million for high-solids paste formulations by 2026.
Polymer-Filler Compatibility Limits in High-Viscosity Systems
At ceramic loadings of 80 vol%, steric stabilization fails as inter-particle gaps shrink below twice the dispersant's hydrodynamic radius. Bottlebrush polysiloxanes with octadecyl grafts achieve 87.8 vol% alumina and 8.181 W/m*K but are 40% more expensive than linear PDMS, limiting their application to AI accelerators. Compatibility issues arise during reliability tests, where amine-terminated dispersants migrate, reducing conductivity by 18% after 500 thermal cycles. In contrast, phosphonate variants retain 96% conductivity.
Other drivers and restraints analyzed in the detailed report include:
- Safety-Driven Shift to Low-VOC, Halogen-Free Dispersants
- OEM Decarbonization Targets Favor Recyclable Chemistries
- PFAS Phase-Out Tightening Specialty-Solvent Availability
For complete list of drivers and restraints, kindly check the Table Of Contents.
Segment Analysis
Boron nitride secured 34.22% of the thermally conductive filler dispersants market share in 2025, attributed to its 300 W/m*K through-plane conductivity and 1013 Ω*cm resistivity. However, graphite and graphene, expanding at a 7.33% CAGR through 2031, are challenging this position as Chinese synthetic-graphite capacity increases by 4 million m2 annually in Vietnam, benefiting from 35% lower labor costs. Aluminum oxide remains critical for cost-sensitive applications targeting 3-5 W/m*K, with bottlebrush polysiloxane dispersants reducing the performance gap to BN at one-fifth of the material cost.
Silicon carbide, with its 120 W/m*K conductivity, is the preferred choice for mechanical reinforcement in under-hood electronics, although its 950 °C oxidation step adds USD 8-12 per kg in processing costs. Moisture-sensitive aluminum nitride remains a niche material but benefits from Parylene-C passivation, which retains 97% conductivity after boiling-water immersion, enabling aerospace qualification pipelines.
Liquid dispersions held 46.36% of the thermally conductive filler dispersants market in 2025, supported by viscosities below 15 Pa*s that allow jetting into sub-50 µm bond lines. However, paste and gel systems are growing at an 8.02% CAGR through 2031, driven by data-center operators' need for materials that can withstand +-0.5 mm stack tolerances without pump-out. Bergquist TGF 10000 demonstrates that thixotropy can coexist with thermal performance, maintaining 10 W/m*K and less than 5% thickness drift over 1,000 cycles.
Powder additives support thermoplastic compounders, while gel TIMs offer Shore 00 hardness of 60-70, conforming to irregular geometries. Screen printing reduces labor costs by USD 0.32 per unit, even after accounting for the 18% dose premium of thixotropic modifiers. The solids content ceiling remains at 85 vol%; exceeding this limit results in yield stress issues during dispensing. Bottlebrush-stabilized pourable liquids surpass this threshold but are limited to AI servers, where USD 28 per kg dispersant costs are justified by 700 W chip loads.
Geography Analysis
Asia-Pacific generated 44.45% of 2025 revenue and is set to grow at an 8.38% CAGR through 2031 on the back of China's AI-server build-outs and South Korea's specialty silicone expansions. Shenzhen Feirongda reported RMB 5.031 billion (USD 693 million) 2024 revenue and greater than 110% 2025 profit growth from partnering with Huawei and BYD. China's Siquan New Materials, running 97.47% utilization, is adding 4 million m2 synthetic-graphite film capacity in Vietnam to leverage 35% cheaper labor. South Korea, buoyed by Wacker and Denka investments, positions Ulsan and Iksan as hubs for BN and silicone TIM innovation.
In North America, DuPont's Battery Technology Center in Michigan aligns with Inflation Reduction Act sourcing rules, while Henkel's USD 30 million Brandon expansion will raise Bergquist output 40% by 2027 to serve hyperscale data centers using 700 W GPUs. Canada's demand is tied to electric-bus mandates, whereas Mexico supplies cost-optimized alumina TIMs to Tier 2 automotive plants.
Europe is anchored by strict REACH rules, pushing suppliers toward low-VOC water-based dispersions even as high energy costs squeeze margins. Dow is evaluating UK and German siloxane cutbacks but keeps its Alberta Path2Zero cracker on schedule for 2029 ethylene feedstock integration. Meanwhile, OEM decarbonization pledges accelerate recyclable thermoplastic TIM adoption, giving an opening to bio-based chemistries.
South America and Middle-East and Africa collectively hold lower shares. Brazil's flex-fuel hybrids and Saudi Aramco's petrochemical growth spur niche TIM demand, but limited local filler production continues to hinder rapid uptake.
- 3M
- Arkema
- ATLANTA
- Avient Corporation
- Cabot Corporation
- Dow
- DuPont
- Evonik Industries AG
- Henkel AG & Co. KGaA
- Momentive
- Resonac Holdings Corporation
- SANYO CHEMICAL, LTD.
- Shin-Etsu Chemical Co., Ltd.
- Sumitomo Chemical Co., Ltd.
- Wacker Chemie AG
Additional Benefits:
- The market estimate (ME) sheet in Excel format
- 3 months of analyst support
TABLE OF CONTENTS
1 Introduction
- 1.1 Study Assumptions and Market Definition
- 1.2 Scope of the Study
2 Research Methodology
3 Executive Summary
4 Market Landscape
- 4.1 Market Overview
- 4.2 Market Drivers
- 4.2.1 Surge in EV battery and power-module heat-flux density
- 4.2.2 Semiconductor node-shrink driven hotspot management
- 4.2.3 Safety-driven shift to low-VOC, halogen-free dispersants
- 4.2.4 OEM decarbonisation targets favour recyclable dispersant chemistries
- 4.2.5 Hybrid BN + graphene filler networks lowering dispersant loadings
- 4.3 Market Restraints
- 4.3.1 Polymer/filler compatibility limits in high-viscosity systems
- 4.3.2 PFAS phase-out tightening specialty-solvent availability
- 4.3.3 Shear-induced damage to high-aspect-ratio fillers during compounding
- 4.4 Value Chain Analysis
- 4.5 Porter's Five Forces
- 4.5.1 Threat of New Entrants
- 4.5.2 Bargaining Power of Buyers
- 4.5.3 Bargaining Power of Suppliers
- 4.5.4 Threat of Substitutes
- 4.5.5 Competitive Rivalry
5 Market Size and Growth Forecasts (Value)
- 5.1 By Filler Type
- 5.1.1 Boron Nitride (BN)
- 5.1.2 Aluminum Oxide (Al2O3)
- 5.1.3 Aluminum Nitride (AlN)
- 5.1.4 Silicon Carbide (SiC)
- 5.1.5 Graphite and Graphene
- 5.1.6 Ceramic Microspheres and Glass Beads
- 5.1.7 Other Filler Types (Carbon Black, Hybrid)
- 5.2 By Formulation
- 5.2.1 Liquid Dispersions
- 5.2.2 Powder Additives
- 5.2.3 Paste/Gel Systems
- 5.3 By Application
- 5.3.1 Thermal Interface Materials (TIMs)
- 5.3.2 Electrically-Insulating Compounds
- 5.3.3 Thermal Greases and Adhesives
- 5.3.4 Gap Fillers and Potting Compounds
- 5.3.5 Encapsulation and Underfills
- 5.3.6 Other Applications
- 5.4 By End-user Industry
- 5.4.1 Electronics
- 5.4.2 Automotive and Transportation
- 5.4.3 Building and Construction
- 5.4.4 Power Generation
- 5.4.5 Industrial
- 5.4.6 Aerospace
- 5.4.7 Other End-user Industries (Medical, etc.)
- 5.5 By Geography
- 5.5.1 Asia-Pacific
- 5.5.1.1 China
- 5.5.1.2 India
- 5.5.1.3 Japan
- 5.5.1.4 South Korea
- 5.5.1.5 ASEAN Countries
- 5.5.1.6 Rest of Asia-Pacific
- 5.5.2 North America
- 5.5.2.1 United States
- 5.5.2.2 Canada
- 5.5.2.3 Mexico
- 5.5.3 Europe
- 5.5.3.1 Germany
- 5.5.3.2 United Kingdom
- 5.5.3.3 France
- 5.5.3.4 Italy
- 5.5.3.5 Spain
- 5.5.3.6 Russia
- 5.5.3.7 NORDIC Countries
- 5.5.3.8 Rest of Europe
- 5.5.4 South America
- 5.5.4.1 Brazil
- 5.5.4.2 Argentina
- 5.5.4.3 Rest of South America
- 5.5.5 Middle-East and Africa
- 5.5.5.1 Saudi Arabia
- 5.5.5.2 South Africa
- 5.5.5.3 Rest of Middle-East and Africa
- 5.5.1 Asia-Pacific
6 Competitive Landscape
- 6.1 Market Concentration
- 6.2 Strategic Moves
- 6.3 Market Share (%)/Ranking Analysis
- 6.4 Company Profiles (includes Global level Overview, Market level overview, Core Segments, Financials as available, Strategic Information, Products and Services, and Recent Developments)
- 6.4.1 3M
- 6.4.2 Arkema
- 6.4.3 ATLANTA
- 6.4.4 Avient Corporation
- 6.4.5 Cabot Corporation
- 6.4.6 Dow
- 6.4.7 DuPont
- 6.4.8 Evonik Industries AG
- 6.4.9 Henkel AG & Co. KGaA
- 6.4.10 Momentive
- 6.4.11 Resonac Holdings Corporation
- 6.4.12 SANYO CHEMICAL, LTD.
- 6.4.13 Shin-Etsu Chemical Co., Ltd.
- 6.4.14 Sumitomo Chemical Co., Ltd.
- 6.4.15 Wacker Chemie AG
7 Market Opportunities and Future Outlook
- 7.1 White-space and Unmet-Need Assessment

