
PUBLISHER: Mordor Intelligence | PRODUCT CODE: 2062426

PUBLISHER: Mordor Intelligence | PRODUCT CODE: 2062426
Static Application Security Testing - Market Share Analysis, Industry Trends & Statistics, Growth Forecasts (2026 - 2031)
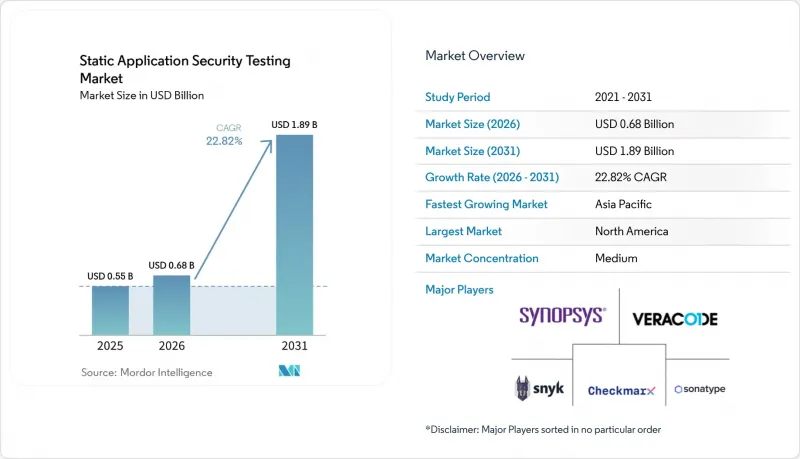
According to Mordor Intelligence, the static application security testing market size was valued at USD 0.55 billion in 2025 and is expected to grow from USD 0.68 billion in 2026 to reach USD 1.89 billion by 2031, at a 22.82% CAGR over 2026-2031.
This report is Segmented by Deployment Mode (On-Premises, Cloud-Based, and Hybrid), Organization Size (Large Enterprises, and Small and Medium Enterprises), End-User Industry (IT and Telecommunications, Banking, Financial Services, and More), Integration Phase (IDE Plugins, CI/CD Pipeline, and More), and Geography. The Market Forecasts are Provided in Terms of Value (USD).
Global Static Application Security Testing Market Trends and Insights
API-first SDLC shift
Modern software relies on microservices that communicate through well-defined API endpoints. Static scanners built for monolithic code often miss authentication weaknesses or excessive data exposure across these endpoints. Retailer Sally Beauty gained full API inventory visibility within 30 days by adding API-aware scanners, underscoring measurable benefits. Organisations shifting to API-centric architectures report 40% higher vulnerability detection when using scanners that parse Swagger or OpenAPI files alongside source code. This premium capability raises average selling prices, lifting revenue across the static application security testing market. The driver remains strongest in North America and Western Europe where microservices adoption is most mature.
Mandates on software SBOMs
Government orders now require suppliers to ship a software bill of materials that lists every open-source component. The OWASP 2025 advisory links 60% of critical Java bugs to third-party libraries, so buyers view SBOM functions as proof of secure code. Federal agencies such as the US Centers for Medicare & Medicaid Services have rolled out secret-scanning policies that reward vendors capable of real-time dependency monitoring. Vendors that automate SBOM generation and correlate findings with known CVEs widen their addressable base, fuelling growth for the static application security testing market.
High false-positive fatigue
Security analysts dedicate 70% of investigation time to alerts that turn out to be non-issues. This burden erodes trust and slows rollout of new policies. Smaller teams often mute scanner output, raising the risk of missed exploits. Vendors respond with machine-learning classifiers that push false-positive rates below 0.1%, but premium modules add cost that many mid-market buyers hesitate to absorb. Until accuracy improves across entry-level tiers, purchase cycles in the SAST market may elongate.
Other drivers and restraints analyzed in the detailed report include:
- Rise of AI-generated code
- DevSecOps tool-chain consolidation
- Shortage of AppSec engineers
For complete list of drivers and restraints, kindly check the Table Of Contents.
Segment Analysis
On-premises deployments held 47.02% of 2025 revenue as European banks, defense contractors, and healthcare providers retain code repositories behind their firewalls to meet DORA and GDPR oversight. Static application security testing market size gains here come from perpetual licenses bundled with professional services for high-assurance environments. Cloud-based scanning will nonetheless climb at a 24.4% CAGR to 2031, propelled by elastic compute that accelerates parallel scans across microservices. Hybrid models, which keep artifacts local yet offload compute to managed cloud nodes, balance sovereignty with scale and are emerging as preferred architectures for regulated entities.
Control versus velocity defines purchasing decisions. Cloud platforms integrate natively with GitHub, GitLab, and Azure DevOps, shrinking time-to-value, while on-premises installations incur infrastructure maintenance costs. Sovereign cloud regions offered by hyperscalers could erode the compliance advantage of on-premises tools. Vendors delivering identical feature sets across deployment options without price penalties position best to capture organizations navigating evolving residency mandates in the SAST market.
Large enterprises generated 70.3% of 2025 revenue by embedding SAST into sprawling codebases and demanding deep customization. They negotiate enterprise-wide contracts that fold in training, premium support, and SLAs, producing predictable renewal streams. Small and medium enterprises, however, are forecast to add double-digit revenue at a 23.3% CAGR through 2031 as vendors introduce per-developer seat models and metered scanning that drop upfront costs.
Free community tiers from GitHub and SonarSource seed adoption, while AI-guided remediation lowers the expertise needed to interpret scan results. Once SMEs mature, upselling advanced capabilities such as SBOM generation and cross-file taint analysis increases contract value. Vendors excelling at land-and-expand motions convert grassroots developer adoption into organization-wide rollouts, expanding static application security testing market penetration across the mid-market.
Geography Analysis
North America captured 38.2% of 2025 revenue, propelled by CISA's USD 331 million Continuous Diagnostics and Mitigation budget and embedded SBOM pilots that turn SAST into a contract deliverable. OMB's shift to risk-based attestations rewards platforms that correlate static findings with runtime exposure, driving refreshed procurement among federal suppliers. Canada is aligning procurement language, and Mexican regulators are applying DORA-style operational testing to cross-border banks, extending regional headroom.
Asia-Pacific is the fastest mover with a 25.27% CAGR forecast to 2031. Taiwan's 2025 National Cybersecurity Strategy requires secure-by-design attestations across semiconductor and infrastructure supply chains. New Zealand's 2026-2030 cybersecurity roadmap targets quantum readiness and critical-infrastructure resilience, prompting utilities to adopt code scanning. Fragmented regulations in China, Japan, India, and South Korea create localization complexity that favors vendors with multilingual rule sets and regional support teams.
Europe sits at a compliance crossroads. DORA took effect in January 2025, imposing four-hour incident reporting and threat-led penetration cycles that include source-code assessments, while NIS2 and the Cyber Resilience Act layer additional obligations. Only 14 of 27 member states fully transposed NIS2 by mid-2025, yet enforcement fines reach EUR 10 million (USD 11.8 million), pushing enterprises to fast-track SAST rollouts. Sovereign-cloud incentives and on-premises favoritism persist among banks and insurers, but hybrid models broaden appeal by balancing oversight with elasticity.
- Synopsys Inc.
- Veracode Inc.
- Checkmarx Ltd.
- IBM Corporation
- Micro Focus Software Inc. (OpenText)
- HCL Software
- GitLab Inc.
- GitHub Inc.
- SonarSource SA
- Perforce Software Inc. (Klocwork)
- CAST Software
- Parasoft Corporation
- GrammaTech Inc.
- Embold Technologies GmbH
- Kiuwan Software SL
- Contrast Security Inc.
- ShiftLeft Inc.
- DeepSource Technologies Inc.
- RIPS Technologies
- OX-Security Ltd.
Additional Benefits:
- The market estimate (ME) sheet in Excel format
- 3 months of analyst support
TABLE OF CONTENTS
1 INTRODUCTION
- 1.1 Study Assumptions and Market Definition
- 1.2 Scope of the Study
2 RESEARCH METHODOLOGY
3 EXECUTIVE SUMMARY
4 MARKET LANDSCAPE
- 4.1 Market Overview
- 4.2 Market Drivers
- 4.2.1 API-First SDLC Shift
- 4.2.2 Mandates on Software SBOMs
- 4.2.3 Rise of AI-Generated Code
- 4.2.4 DevSecOps Tool-Chain Consolidation
- 4.2.5 Quantum-Resistant Cryptography Audit Need
- 4.2.6 Secure-by-Design Procurement Clauses
- 4.3 Market Restraints
- 4.3.1 High False-Positive Fatigue
- 4.3.2 Shortage of AppSec Engineers
- 4.3.3 Legacy Monolith Refactoring Cost
- 4.3.4 Data-Residency Compliance Hurdles
- 4.4 Industry Value Chain Analysis
- 4.5 Impact of Macroeconomic Factors on the Market
- 4.6 Regulatory Landscape
- 4.7 Technological Outlook
- 4.8 Porter's Five Forces Analysis
- 4.8.1 Threat of New Entrants
- 4.8.2 Buyer Power
- 4.8.3 Supplier Power
- 4.8.4 Substitutes
- 4.8.5 Competitive Rivalry
5 MARKET SIZE AND GROWTH FORECASTS (VALUE)
- 5.1 By Deployment Mode
- 5.1.1 On-Premises
- 5.1.2 Cloud-Based
- 5.1.3 Hybrid
- 5.2 By Organization Size
- 5.2.1 Large Enterprises
- 5.2.2 Small and Medium Enterprises
- 5.3 By End-User Industry
- 5.3.1 IT and Telecommunications
- 5.3.2 Banking, Financial Services and Insurance
- 5.3.3 Healthcare and Life Sciences
- 5.3.4 Government and Defense
- 5.3.5 Retail and E-Commerce
- 5.3.6 Manufacturing and Automotive
- 5.3.7 Other End-User Industry (Energy, Education)
- 5.4 By Integration Phase
- 5.4.1 IDE Plugins
- 5.4.2 CI/CD Pipeline
- 5.4.3 Centralized Scanning
- 5.5 By Geography
- 5.5.1 North America
- 5.5.1.1 United States
- 5.5.1.2 Canada
- 5.5.1.3 Mexico
- 5.5.2 South America
- 5.5.2.1 Brazil
- 5.5.2.2 Argentina
- 5.5.2.3 Rest of South America
- 5.5.3 Europe
- 5.5.3.1 Germany
- 5.5.3.2 United Kingdom
- 5.5.3.3 France
- 5.5.3.4 Italy
- 5.5.3.5 Rest of Europe
- 5.5.4 Asia-Pacific
- 5.5.4.1 China
- 5.5.4.2 Japan
- 5.5.4.3 India
- 5.5.4.4 South Korea
- 5.5.4.5 Rest of Asia-Pacific
- 5.5.5 Middle East and Africa
- 5.5.5.1 Middle East
- 5.5.5.1.1 Saudi Arabia
- 5.5.5.1.2 United Arab Emirates
- 5.5.5.1.3 Rest of Middle East
- 5.5.5.2 Africa
- 5.5.5.2.1 South Africa
- 5.5.5.2.2 Nigeria
- 5.5.5.2.3 Rest of Africa
- 5.5.5.1 Middle East
- 5.5.1 North America
6 COMPETITIVE LANDSCAPE
- 6.1 Market Concentration
- 6.2 Strategic Moves
- 6.3 Market Share Analysis
- 6.4 Company Profiles (includes Global Level Overview, Market Level Overview, Core Segments, Financials as available, Strategic Information, Market Rank/Share, Products and Services, Recent Developments)
- 6.4.1 Synopsys Inc.
- 6.4.2 Veracode Inc.
- 6.4.3 Checkmarx Ltd.
- 6.4.4 IBM Corporation
- 6.4.5 Micro Focus Software Inc. (OpenText)
- 6.4.6 HCL Software
- 6.4.7 GitLab Inc.
- 6.4.8 GitHub Inc.
- 6.4.9 SonarSource SA
- 6.4.10 Perforce Software Inc. (Klocwork)
- 6.4.11 CAST Software
- 6.4.12 Parasoft Corporation
- 6.4.13 GrammaTech Inc.
- 6.4.14 Embold Technologies GmbH
- 6.4.15 Kiuwan Software SL
- 6.4.16 Contrast Security Inc.
- 6.4.17 ShiftLeft Inc.
- 6.4.18 DeepSource Technologies Inc.
- 6.4.19 RIPS Technologies
- 6.4.20 OX-Security Ltd.
7 MARKET OPPORTUNITIES AND FUTURE OUTLOOK
- 7.1 White-Space and Unmet-Need Assessment

