
PUBLISHER: Mordor Intelligence | PRODUCT CODE: 2062474

PUBLISHER: Mordor Intelligence | PRODUCT CODE: 2062474
Fifth-party Logistics (5PL) - Market Share Analysis, Industry Trends & Statistics, Growth Forecasts (2026 - 2031)
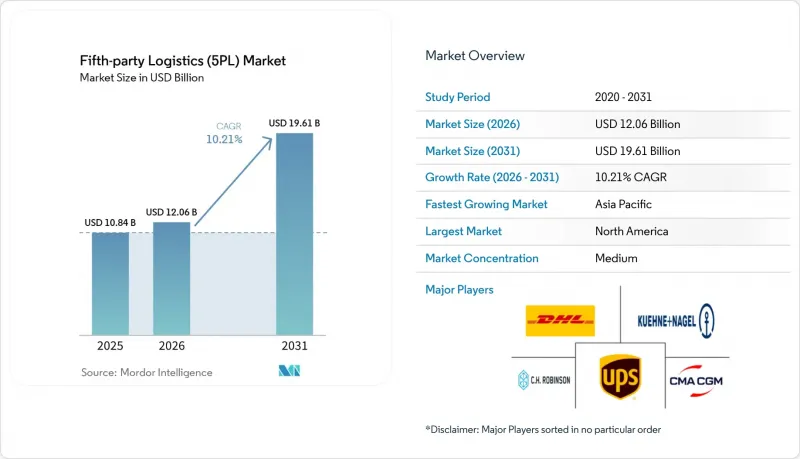
According to Mordor Intelligence, the fifth-Party logistics market size is expected to increase from USD 10.84 billion in 2025 to USD 12.06 billion in 2026 and reach USD 19.61 billion by 2031, growing at a CAGR of 10.21% over 2026-2031.
This report is Segmented by Service Model (Transportation Services, and More), by End-User Industry (E-Commerce & Retail, and More), by Business Model (Direct To E-Commerce, Aggregator/Integrator for 3PL/4PL, and More), by Enterprise Size (Large Enterprises, and More), and by Geography (North America, South America, and More). The Market Forecasts are Provided in Terms of Value (USD).
Global Fifth-party Logistics (5PL) Market Trends and Insights
Direct-to-Consumer Brand Expansion Fueling Turnkey Fulfillment Demand
Digital-first brands are reshaping procurement strategies by insisting on single-source logistics that cover warehousing, shipping, and returns under a single contract. Academic studies show that omnichannel retailers need inventory algorithms that can serve storefronts, online orders, and pickup points simultaneously, a complexity that favors Fifth-Party Logistics market providers. These brands rarely have the scale to build networks on their own, so turnkey 5PL solutions collapse multi-year infrastructure timelines into weeks. Social commerce adoption in the Asia-Pacific further amplifies demand for platforms that blend payments, inventory visibility, and same-day delivery. Superior fulfillment now directly influences customer acquisition costs, making integrated 5PL partnerships a strategic marketing lever.
Heightened Omnichannel Inventory Complexity Post-Pandemic
The pandemic pushed retailers to run physical stores and digital channels in parallel, multiplying the number of stock-placement decisions. Research confirms companies must synchronize many fulfillment nodes to hit service targets without inflating working capital. Off-the-shelf tools are inadequate for balancing seasonality, promotions, and real-time demand sensing. Fifth-Party Logistics market leaders solve this by embedding machine-learning engines inside control towers that continuously reposition goods. Retailers benefit from higher service levels and reduced safety stocks, turning logistics optimization into a margin driver.
Capital-Heavy Build-Out of Global Micro-Fulfillment Networks
Same-day delivery requires micro-warehouses in dense urban areas, but high land prices and the cost of automation equipment push capital requirements beyond the reach of smaller entrants. Break-even analysis shows profitability hinges on high order density, an uncertain variable in many locales. Inventory segregation for multiple clients also drives overhead, eroding utilization rates. These economics encourage consolidation as well-funded providers purchase rivals to secure prime sites. Up-front spending slows expansion pace, trimming overall industry CAGR.
Other drivers and restraints analyzed in the detailed report include:
- Supply-Chain Resilience Needs Amid Geopolitical Disruptions
- Plug-and-Play Robotics-as-a-Service Bundled into 5PL Contracts
- Ocean-Freight Capacity Volatility Weakening Optimization Accuracy
For complete list of drivers and restraints, kindly check the Table Of Contents.
Segment Analysis
Transportation Services controlled 49.83% of the Fifth-Party Logistics market share in 2025, yet commoditization pressures are redirecting spending toward Value-Added Services that are accelerating at a 15.59% CAGR through 2031. Clients increasingly view freight movement as a baseline requirement and award contracts based on the provider's ability to deliver consulting, analytics, and blockchain integration in one bundle. This mix change is expanding the Fifth-Party Logistics market size for advisory functions that once sat outside core logistics budgets. Road transport still dominates last-mile delivery because parcel density supports frequent routes, while multimodal optimization tools shift non-urgent volumes to sea lanes to shrink carbon footprints.
Robotics-as-a-service deployments underscore the pivot. Providers such as DHL integrate fleets of Locus autonomous mobile robots under variable-cost arrangements, improving pick rates for shippers without capital expense. Inventory management modules increasingly embed blockchain to meet Digital Product Passport mandates in Europe. These capabilities boost cross-sell revenue per customer and raise switching costs well above those in traditional rate-based relationships. As advisory and tech income grow faster than trucking revenue, market valuations now hinge on intellectual property and depth of data analytics.
E-commerce & Retail retained 37.97% share of the Fifth-Party Logistics market in 2025 thanks to direct-to-consumer momentum, yet Healthcare & Pharma is projected to climb at a 13.35% CAGR, making it the fastest-growing end-user bloc. Vaccine temperature-control mandates and anti-counterfeit regulations compel full traceability, an area where 5PL platforms that marry blockchain and Internet-of-Things sensors excel. Retailers still dominate by volume, but pharmaceuticals deliver higher revenue per unit because of specialized packaging and compliance tasks. The convergence of social commerce and livestream shopping in the Asia-Pacific increases cross-border parcel counts, reinforcing demand for unified customs documentation and duty-payment automation.
Food & Beverage companies also gravitate to Fifth-Party Logistics market providers for cold-chain orchestration that aligns inventory with fluctuating restaurant and grocery demand. Industrial manufacturers leverage 5PL control towers to coordinate inbound parts with outbound finished goods, reducing dwell times. Across sectors, the thread that unites adopters is rising supply-chain complexity that small internal teams cannot easily master.
Geography Analysis
North America held 36.72% of the Fifth-Party Logistics market revenue in 2025, underpinned by mature e-commerce ecosystems and early adoption of robotics-as-a-service, which lowers automation entry costs for warehouse operators. Regulatory scrutiny over algorithmic bias in carrier allocation is strongest in the United States and Canada, prompting leading providers to embed fairness audits and explainable-AI components in their routing engines. Direct-to-consumer brand proliferation is adding parcel density that justifies micro-fulfillment rollout in secondary cities, while embedded finance on logistics platforms is gaining traction among small sellers seeking alternative credit.
Asia Pacific is the fastest-growing region with an 11.97% CAGR through 2031. Cross-border e-commerce corridors linking China, Southeast Asia, and Australia generate high-frequency parcel flows that benefit from unified customs clearance and duty pre-payment features. Government grants for supply-chain digitalization in India and Indonesia encourage mid-tier manufacturers to outsource orchestration to the Fifth-Party Logistics market platforms. Urban congestion fees in major Chinese cities are pushing warehouse operators to adopt autonomous mobile robots that can work in tighter footprints, accelerating RaaS uptake. Nearshoring trends also spur investment in Vietnamese and Thai fulfillment hubs as brands diversify away from single-country sourcing.
Europe maintains steady growth driven by far-reaching sustainability regulations. The Carbon Border Adjustment Mechanism demands granular emissions reporting, prompting importers to enlist 5PL providers with certified calculation engines. The Digital Product Passport program accelerates blockchain deployment across fashion and electronics supply chains. Providers offering packaged compliance plus fulfillment gain an advantage over asset-heavy rivals focused solely on transport. Although South America and the Middle East & Africa lag in infrastructure, select urban centers see pilot projects for shared micro-fulfillment, signaling future catch-up potential as capital becomes available.
- DHL Supply Chain (DHL Group)
- CEVA Logistics (CMA CGM Group)
- Kuehne + Nagel International AG
- UPS Supply Chain Solutions
- C.H. Robinson Worldwide
- DSV A/S
- DB Schenker
- Maersk Logistics and Services
- GXO Logistics
- GEODIS
- Ryder System, Inc.
- Nippon Express Holdings (NX Group)
- Toll Group
- Amazon Global Logistics
- Cainiao Smart Logistics Network (Alibaba Group)
- JD Logistics
- Uber Freight
- Flexport Inc.
- Sennder Technologies
- ShipBob
- Expeditors International of Washington, Inc.
Additional Benefits:
- The market estimate (ME) sheet in Excel format
- 3 months of analyst support
TABLE OF CONTENTS
1 Introduction
- 1.1 Study Assumptions & Market Definition
- 1.2 Scope of the Study
2 Research Methodology
3 Executive Summary
4 Market Landscape
- 4.1 Market Overview
- 4.2 Market Drivers
- 4.2.1 Direct-to-consumer brand expansion fuelling turnkey fulfilment demand
- 4.2.2 Heightened Omni-Channel Inventory Complexity Post-Pandemic
- 4.2.3 Blockchain Provenance Mandates Enhancing Outsourcing Appeal
- 4.2.4 Supply-Chain Resilience Needs Amid Geopolitical Disruptions
- 4.2.5 Plug-and-Play Robotics-as-a-Service Bundled into 5Pl Contracts
- 4.2.6 Embedded Finance Services Within 5Pl Control-Tower Platforms
- 4.3 Market Restraints
- 4.3.1 Capital-Heavy Build-Out of Global Micro-Fulfilment Networks
- 4.3.2 Ocean-Freight Capacity Volatility Weakening Optimisation Accuracy
- 4.3.3 Regulatory Scrutiny of Algorithmic Bias In Carrier Allocation
- 4.3.4 Carbon Border Adjustment Compliance Burden on 5Pl Providers
- 4.4 Porter's Five Forces
- 4.4.1 Threat of New Entrants
- 4.4.2 Bargaining Power of Buyers
- 4.4.3 Bargaining Power of Suppliers
- 4.4.4 Threat of Substitutes
- 4.4.5 Competitive Rivalry
- 4.5 Value / Supply-Chain Analysis
- 4.6 Technological Innovations in the Industry
- 4.7 Government Regulations and Policies
- 4.8 Impact of Geopolitical Events on the Market
5 Market Size & Growth Forecasts
- 5.1 By Service Model
- 5.1.1 Transportation Services
- 5.1.1.1 Road
- 5.1.1.2 Air
- 5.1.1.3 Sea
- 5.1.1.4 Multimodal
- 5.1.2 Warehousing & Fulfillments
- 5.1.3 Inventory Mangement
- 5.1.4 Value Added Services (tech, analytics, consulting, etc.)
- 5.1.1 Transportation Services
- 5.2 By End-user Industry
- 5.2.1 E-commerce & Retail
- 5.2.2 Consumer Packaged Goods
- 5.2.3 Food & Beverage (incl. Cold-chain)
- 5.2.4 Healthcare & Pharma
- 5.2.5 Industrial & Manufacturing
- 5.2.6 Others
- 5.3 By Business Model / Client Type
- 5.3.1 Direct to E-commerce
- 5.3.2 Aggregator/Integrator for 3PL/4PL
- 5.3.3 Custom Supply Chain Orchestration for Enterprises
- 5.3.4 Platform-based, Technology-driven Outsourcing
- 5.3.5 Others (Government/public sector, alliance-based logistics orchestration, project based events/exhibitions)
- 5.4 By Enterprise Size
- 5.4.1 Large Enterprises
- 5.4.2 Small & Medium Enterprises (SMEs)
- 5.5 By Geography
- 5.5.1 North America
- 5.5.1.1 United States
- 5.5.1.2 Canada
- 5.5.1.3 Mexico
- 5.5.2 South America
- 5.5.2.1 Brazil
- 5.5.2.2 Peru
- 5.5.2.3 Chile
- 5.5.2.4 Argentina
- 5.5.2.5 Rest of South America
- 5.5.3 Asia-Pacific
- 5.5.3.1 India
- 5.5.3.2 China
- 5.5.3.3 Japan
- 5.5.3.4 Australia
- 5.5.3.5 South Korea
- 5.5.3.6 Southeast Asia (Singapore, Malaysia, Thailand, Indonesia, Vietnam, and Philippines)
- 5.5.3.7 Rest of Asia-Pacific
- 5.5.4 Europe
- 5.5.4.1 United Kingdom
- 5.5.4.2 Germany
- 5.5.4.3 France
- 5.5.4.4 Spain
- 5.5.4.5 Italy
- 5.5.4.6 BENELUX (Belgium, Netherlands, and Luxembourg)
- 5.5.4.7 NORDICS (Denmark, Finland, Iceland, Norway, and Sweden)
- 5.5.4.8 Rest of Europe
- 5.5.5 Middle East and Africa
- 5.5.5.1 United Arab Emirates
- 5.5.5.2 Saudi Arabia
- 5.5.5.3 South Africa
- 5.5.5.4 Nigeria
- 5.5.5.5 Rest of Middle East and Africa
- 5.5.1 North America
6 Competitive Landscape
- 6.1 Market Concentration
- 6.2 Strategic Moves
- 6.3 Market Share Analysis
- 6.4 Company Profiles (includes Global level Overview, Market level overview, Core Segments, Financials as available, Strategic Information, Market Rank/Share for key companies, Products & Services, and Recent Developments)
- 6.4.1 DHL Supply Chain (DHL Group)
- 6.4.2 CEVA Logistics (CMA CGM Group)
- 6.4.3 Kuehne + Nagel International AG
- 6.4.4 UPS Supply Chain Solutions
- 6.4.5 C.H. Robinson Worldwide
- 6.4.6 DSV A/S
- 6.4.7 DB Schenker
- 6.4.8 Maersk Logistics and Services
- 6.4.9 GXO Logistics
- 6.4.10 GEODIS
- 6.4.11 Ryder System, Inc.
- 6.4.12 Nippon Express Holdings (NX Group)
- 6.4.13 Toll Group
- 6.4.14 Amazon Global Logistics
- 6.4.15 Cainiao Smart Logistics Network (Alibaba Group)
- 6.4.16 JD Logistics
- 6.4.17 Uber Freight
- 6.4.18 Flexport Inc.
- 6.4.19 Sennder Technologies
- 6.4.20 ShipBob
- 6.4.21 Expeditors International of Washington, Inc.
7 Market Opportunities & Future Outlook

