
PUBLISHER: Mordor Intelligence | PRODUCT CODE: 2063233

PUBLISHER: Mordor Intelligence | PRODUCT CODE: 2063233
Weather Monitoring Solutions And Services - Market Share Analysis, Industry Trends & Statistics, Growth Forecasts (2026 - 2031)
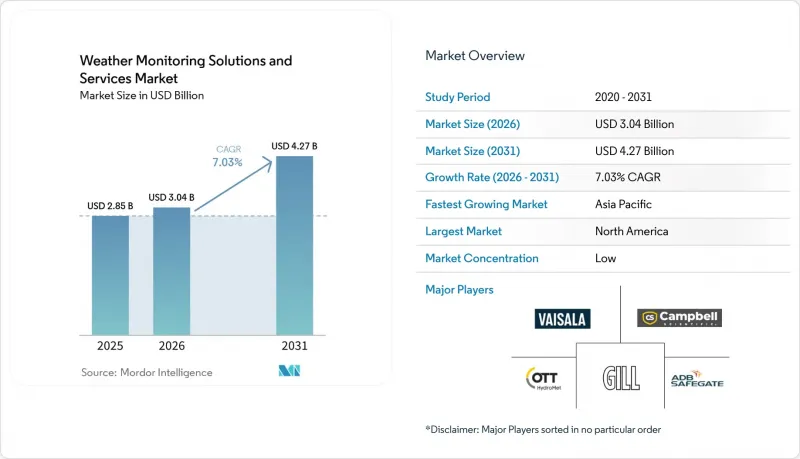
According to Mordor Intelligence, the weather monitoring solutions and services market size was valued at USD 2.85 billion in 2025 and is estimated to grow from USD 3.04 billion in 2026 to reach USD 4.27 billion by 2031, at a CAGR of 7.03% during the forecast period (2026-2031).
This report is Segmented by Offering (Hardware, Software, and Services), System Type (Ground-Based, Weather Radar, and More), Application (Weather Forecasting, Climate and Environmental Monitoring, and More), End-User Industry (Energy and Utilities, Marine and Offshore, Government and Defense, and More), and Geography. The Market Forecasts are Provided in Terms of Value (USD).
Global Weather Monitoring Solutions And Services Market Trends and Insights
Renewable-Energy Demand for Accurate Resource Assessment
Utilities and project developers now require 1-kilometer, 15-minute forecasts to balance grids with high wind and solar penetration. The European Center for Medium-Range Weather Forecasts introduced an AI forecasting system that delivers 10-day global predictions in under 60 seconds, letting operators run fast ensemble scenarios. Vaisala's Compass platform fuses satellite imagery, drone profiles, and ground sensors to craft site-specific irradiance curves that raise asset utilization. Floating lidar and weather drones deployed in the North Sea reduce turbine-wake modeling error by 15%, cutting maintenance budgets for offshore arrays. As more jurisdictions legislate net-zero targets, investors are treating granular weather intelligence as essential project infrastructure rather than optional insurance.
Climate-Change-Driven Rise in Extreme Weather Events
Insured losses from floods, hurricanes, and wildfires surpassed USD 100 billion in 2024, hardening reinsurance requirements for hyperlocal peril models. The European Union directs EUR 70 billion (USD 77 billion) annually to adaptation infrastructure, funding dense rain-gauge grids and X-band radars for alpine flash-flood defense. NOAA's dual-polarization radar retrofit improves hail-size estimates that underpin municipal evacuation triggers. Japan embeds sensors in stormwater tunnels to automate floodgate closures, shifting from reactive to anticipatory control. The frequency of billion-dollar disasters keeps doubling, yet warning lead times remain stuck at 13 minutes, spotlighting the need for phased-array radar and machine-learning nowcasting.
High Capital Costs for Advanced Radar and Satellite Payloads
S-band dual-polarization radars sell for USD 1 million to USD 5 million per unit, excluding site and power costs that add 15% across the lifecycle. Satellite imagers climb to USD 200 million, dwarfing meteorological budgets in 80% of WMO member states. Spain spent EUR 25 million (USD 27.5 million) on 18 new radars, consuming 40% of its 2024 capital plan. Phased-array prototypes priced at USD 15 million, limiting deployment to the U.S. and Japan research fields. Emerging economies accept coarser coverage from USD 5,000 automatic stations, sacrificing warning lead time for affordability.
Other drivers and restraints analyzed in the detailed report include:
- Adoption of Precision Agriculture and Smart Farming
- Expanding Deployment of IoT-Enabled Sensor Networks
- Proprietary Data Silos and Sharing Restrictions
For complete list of drivers and restraints, kindly check the Table Of Contents.
Segment Analysis
The services segment is expanding at an 8.11% CAGR during the forecast period, outstripping hardware's 44.87% revenue share in 2025. Renewables traders, airlines, and municipalities prefer outcome-based contracts that bundle ingestion, quality control, and analytics, converting capex to opex in the weather monitoring solutions and services market. Baron Services launched a white-label API in 2025 that lets logistics firms embed alerts without hiring meteorologists. Meteomatics' USD 22 million Series C backs drone profiling sold under annual licenses. Hardware sales still anchor government procurements such as India's 1,800-station rollout, but 10-year replacement cycles cap growth. The services tilt lifts vendor margins to 25%, double those of sensor hardware, reinforcing the pivot toward recurring revenue.
Second-generation platforms illustrate hybrid economics. Vaisala bundles sensor packages with its Compass cloud engine, delivering bias-corrected wind curves that shave curtailment penalties. Campbell Scientific's WeatherBrain turns datalogger fleets into variable-rate irrigation maps that agronomists access through software seats. As the installed base expands, customer lock-in rises, and switching costs protect subscriptions, sustaining long-run cash flows within the weather monitoring solutions and services market.
Satellite platforms owned 34.25% share in 2025, supplying continental imagery but limited vertical detail. Weather drones grow at 7.89% as they profile the 0-5 kilometer layer where severe convection forms. Meteomatics operates 30 Meteodrones across Norway, cutting valley forecast error by 20%. Black Swift aircraft entered Hurricane Idalia's eyewall in 2024, shrinking landfall uncertainty by 20 kilometers. Ground stations remain critical yet miss complex terrain signals that drones capture on demand.
Radars upgrade to dual-polarization, distinguishing rain from hail, while phased-array prototypes scan every 30 seconds, but USD 15 million tags stall commercialization. WMO drives low-cost LoRaWAN station growth across Africa, yet a lack of calibration labs undermines data quality. Integrated fleets that mix radar, drone, and satellite streams underpin the weather monitoring solutions and services market size for multi-hazard early warning, strengthening resilience agendas.
Geography Analysis
North America generated 36.67% of 2025 revenue, anchored by FAA NextGen upgrades that replace 1980s sensor arrays with networked devices reporting icing and turbulence in real time. NOAA finished its 160-site radar dual-polarization retrofit in 2024, feeding county-level alert systems that cut tornado false alarms. Solar operators in Texas and California hedge curtailment risk through probabilistic irradiance feeds, translating forecast skill into avoided penalties. Canada expanded WeatherBrain nationwide by 2025, monetizing soil-moisture telemetry for variable-rate irrigation maps.
Asia-Pacific records the fastest 7.78% CAGR. India's USD 2 billion Mausam 2.0 added Doppler units in Leh and Prayagraj in 2025 on a path to 60 radars and 1,800 stations by 2030. China runs 2,400 stations and 236 radars that support its South China Sea offshore wind push. Japan's Himawari-9 satellite provides 10-minute imagery for typhoon tracking, and Himawari-10 launches in 2029 with better volcanic-ash detection. Korea's GEO-KOMPSAT-2A adds 2-kilometer air-quality frames for Seoul smog advisories. ASEAN's multi-hazard network shares radar data across borders, improving monsoon flood warnings.
Europe channels EUR 70 billion (USD 77 billion) annually into resilience works, upgrading dual-polarization radar fleets, and funding nanosatellite payloads. Spain replaced legacy radars under a EUR 25 million contract in 2024, while Greece deployed new sensors for wildfire alerts in 2025. The Middle East invests in radar coverage and AI cloud-seeding forecasts. South America modernizes under WMO technical aid but faces calibration-lab shortages that slow sensor certification. Africa holds the widest gaps; Early Warnings for All targets full population coverage by 2027 through low-cost LoRaWAN nodes and community sirens. Together, regional programs maintain broad engagement, ensuring the weather monitoring solutions and services market continues to diversify geographically.
- Vaisala Oyj
- Campbell Scientific Inc.
- OTT Hydromet GmbH
- Gill Instruments Limited
- ADB SAFEGATE
- Delta OHM S.r.l. a Socio Unico
- Lufft Mess- und Regeltechnik GmbH
- Airmar Technology Corporation
- R.M. Young Company
- Pessl Instruments GmbH
- Hobo / Onset Computer Corporation
- Columbia Weather Systems, Inc.
- Perry Weather, Inc.
- Baron Services, Inc.
- RIKA Sensors Co., Ltd.
- Davis Instruments Corporation
- Teledyne Marine (Teledyne Technologies Inc.)
- Meteomatics AG
- Earth Networks, Inc.
- Senseca Germany GmbH
Additional Benefits:
- The market estimate (ME) sheet in Excel format
- 3 months of analyst support
TABLE OF CONTENTS
1 INTRODUCTION
- 1.1 Study Assumptions and Market Definition
- 1.2 Scope of the Study
2 RESEARCH METHODOLOGY
3 EXECUTIVE SUMMARY
4 MARKET LANDSCAPE
- 4.1 Market Overview
- 4.2 Market Drivers
- 4.2.1 Renewable-Energy Demand for Accurate Resource Assessment
- 4.2.2 Climate-Change-Driven Rise in Extreme Weather Events
- 4.2.3 Adoption of Precision Agriculture and Smart Farming
- 4.2.4 Expanding Deployment of IoT-Enabled Sensor Networks
- 4.2.5 Government Mandates for Aviation and Maritime Safety Compliance
- 4.2.6 Emergence of Low-Earth-Orbit Nanosatellite Constellations
- 4.3 Market Restraints
- 4.3.1 High Capital Costs for Advanced Radar and Satellite Payloads
- 4.3.2 Proprietary Data Silos and Sharing Restrictions
- 4.3.3 Lack of Certified Calibration Labs in Emerging Markets
- 4.3.4 Lithium Supply Tightness for Remote-Sensor Batteries
- 4.4 Industry Value Chain Analysis
- 4.5 Regulatory Landscape
- 4.6 Technological Outlook
- 4.7 Porter's Five Forces Analysis
- 4.7.1 Bargaining Power of Suppliers
- 4.7.2 Bargaining Power of Buyers
- 4.7.3 Threat of New Entrants
- 4.7.4 Threat of Substitutes
- 4.7.5 Intensity of Competitive Rivalry
5 MARKET SIZE AND GROWTH FORECASTS (VALUE)
- 5.1 By Offering
- 5.1.1 Hardware
- 5.1.2 Software
- 5.1.3 Services
- 5.2 By System Type
- 5.2.1 Ground-based Stations
- 5.2.2 Satellite-based Systems
- 5.2.3 Weather Radar
- 5.2.4 Weather Drones/Unmanned Systems
- 5.3 By Application
- 5.3.1 Weather Forecasting
- 5.3.2 Climate and Environmental Monitoring
- 5.3.3 Disaster and Public-Safety Management
- 5.3.4 Renewable-Energy Resource Optimization
- 5.4 By End-user Industry
- 5.4.1 Agriculture
- 5.4.2 Energy and Utilities
- 5.4.3 Aviation and Airports
- 5.4.4 Marine and Offshore
- 5.4.5 Transportation and Logistics
- 5.4.6 Government and Defense
- 5.4.7 Media and Consumer Services
- 5.5 By Geography
- 5.5.1 North America
- 5.5.1.1 United States
- 5.5.1.2 Canada
- 5.5.1.3 Mexico
- 5.5.2 South America
- 5.5.2.1 Brazil
- 5.5.2.2 Argentina
- 5.5.2.3 Rest of South America
- 5.5.3 Europe
- 5.5.3.1 Germany
- 5.5.3.2 United Kingdom
- 5.5.3.3 France
- 5.5.3.4 Italy
- 5.5.3.5 Spain
- 5.5.3.6 Rest of Europe
- 5.5.4 Asia-Pacific
- 5.5.4.1 China
- 5.5.4.2 Japan
- 5.5.4.3 India
- 5.5.4.4 South Korea
- 5.5.4.5 ASEAN
- 5.5.4.6 Rest of Asia-Pacific
- 5.5.5 Middle East and Africa
- 5.5.5.1 Middle East
- 5.5.5.1.1 Saudi Arabia
- 5.5.5.1.2 United Arab Emirates
- 5.5.5.1.3 Turkey
- 5.5.5.1.4 Rest of the Middle East
- 5.5.5.2 Africa
- 5.5.5.2.1 South Africa
- 5.5.5.2.2 Nigeria
- 5.5.5.2.3 Rest of Africa
- 5.5.5.1 Middle East
- 5.5.1 North America
6 COMPETITIVE LANDSCAPE
- 6.1 Market Concentration
- 6.2 Strategic Moves
- 6.3 Market Share Analysis
- 6.4 Company Profiles (includes Global level Overview, Market level overview, Core Segments, Financials as available, Strategic Information, Market Rank/Share for key companies, Products and Services, and Recent Developments)
- 6.4.1 Vaisala Oyj
- 6.4.2 Campbell Scientific Inc.
- 6.4.3 OTT Hydromet GmbH
- 6.4.4 Gill Instruments Limited
- 6.4.5 ADB SAFEGATE
- 6.4.6 Delta OHM S.r.l. a Socio Unico
- 6.4.7 Lufft Mess- und Regeltechnik GmbH
- 6.4.8 Airmar Technology Corporation
- 6.4.9 R.M. Young Company
- 6.4.10 Pessl Instruments GmbH
- 6.4.11 Hobo / Onset Computer Corporation
- 6.4.12 Columbia Weather Systems, Inc.
- 6.4.13 Perry Weather, Inc.
- 6.4.14 Baron Services, Inc.
- 6.4.15 RIKA Sensors Co., Ltd.
- 6.4.16 Davis Instruments Corporation
- 6.4.17 Teledyne Marine (Teledyne Technologies Inc.)
- 6.4.18 Meteomatics AG
- 6.4.19 Earth Networks, Inc.
- 6.4.20 Senseca Germany GmbH
7 MARKET OPPORTUNITIES AND FUTURE OUTLOOK
- 7.1 White-space and Unmet-Need Assessment

