
PUBLISHER: Mordor Intelligence | PRODUCT CODE: 2063234

PUBLISHER: Mordor Intelligence | PRODUCT CODE: 2063234
Asset Optimization Solutions - Market Share Analysis, Industry Trends & Statistics, Growth Forecasts (2026 - 2031)
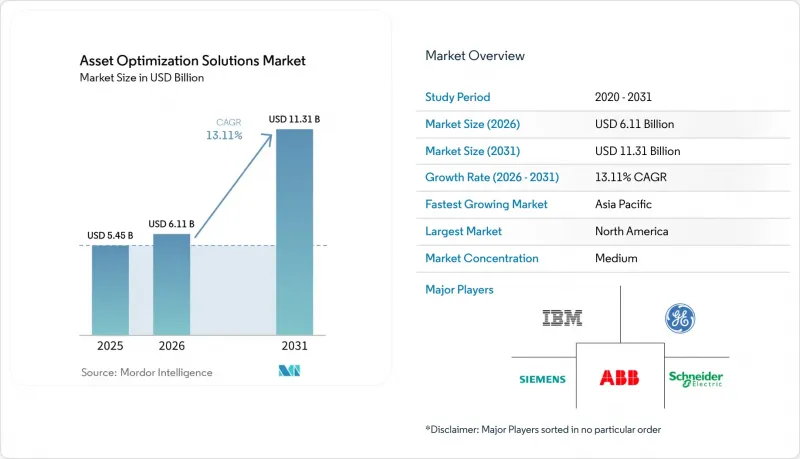
According to Mordor Intelligence, the asset optimization solutions market size was valued at USD 5.45 billion in 2025, USD 6.11 billion in 2026, and is expected to reach USD 11.31 billion by 2031, at a CAGR of 13.11% during the forecast period (2026-2031).
This report is Segmented by Component (Software, and Services), Deployment Mode (On-Premise, and Cloud), Industry Vertical (Oil and Gas, Energy and Utilities, Manufacturing, and More), Enterprise Size (Large Enterprises, and Small and Medium-Sized Enterprises), and Geography (North America, Europe, Asia-Pacific, South America, and More). The Market Forecasts are Provided in Terms of Value (USD).
Global Asset Optimization Solutions Market Trends and Insights
Rapid Digitalization of Industrial Operations
Brownfield assets averaging 25-30 years in age are being retrofitted with sensors, gateways, and cloud APIs at record speed. Germany's Platform Industrie 4.0 pushed 12,000 plants to adopt digital twins by 2025, and France's Industrie du Futur steered EUR 10 billion (USD 11.3 billion) into similar upgrades. Agile manufacturers that rode these programs cut changeover times by 40%, winning orders during the 2024 semiconductor crunch.
Predictive Maintenance Focus to Reduce Unplanned Downtime
Cummins saved USD 18 million in 2025 by catching bearing wear early, while power plant operators stretched turbine runtime up to 15% with condition-based scheduling. Machine-learning models now predict failures 30-60 days ahead with near-90% accuracy, making sensor rollouts economically compelling. Logistics fleets mirror the trend; UPS carved out USD 400 million in fuel and maintenance savings that year.
High Upfront Capital Expenditure
Full-scale programs, costing between USD 2-15 million, extend paybacks to 3-5 years, deterring mid-market adopters. In 2025, Petrobras shelved a planned USD 200 million upgrade, citing borrowing costs exceeding 12%. While SaaS models alleviate financial strain, they hinge on dependable bandwidth, a challenge for both remote mines and offshore rigs. Additionally, the high upfront investment and operational complexities further limit adoption among smaller players. Companies are exploring hybrid models to balance costs and infrastructure challenges.
Other drivers and restraints analyzed in the detailed report include:
- Rise of Industrial Internet of Things Platforms
- Integration of Physics-Based Twins with AI Analytics
- Cyber-Security Vulnerabilities in Connected Assets
For complete list of drivers and restraints, kindly check the Table Of Contents.
Segment Analysis
Services revenue in the asset optimization solutions market grew 14.91% annually through 2031 as firms tackled integration and data-science gaps. IBM Maximo's ninth release still needs 6-12 months of expert configuration, reinforcing demand for consulting and managed services. Vendors pivot toward outcome-based contracts, with AspenTech deriving 40% of turnover from services that include uptime guarantees. The asset optimization solutions market size for services is forecast to widen its lead as labor shortages persist.
Software, while slower, remains indispensable. Platform refreshes bundle AI toolkits and low-code dashboards, but customers lacking governance discipline risk data sprawl. Continuous updates also pressure internal teams to keep skills current, driving renewed outsourcing cycles and reinforcing the services growth flywheel. The increasing reliance on automation and AI-driven tools is also prompting organizations to reassess their digital transformation strategies to remain competitive.
Cloud hosted 48.34% of 2025 spending, primarily for compute-intensive model training, but regulated sectors insist that safety-critical control loops stay local. Schneider Electric's EcoStruxure places edge controllers on-site while forwarding anonymized data to Azure for fleet analytics, cutting egress costs 70-80%. Hybrid thus delivers the lowest total cost of ownership without compromising sovereignty under China's Data Security Law.
Operators also value business continuity. During the 2025 internet disruptions, plants running hybrid architectures sustained production using local AI caches. As a result, the asset optimization solutions market size tied to hybrid deployments is projected to post the fastest CAGR to 2031, eclipsing pure cloud additions in manufacturing, utilities, and pharmaceuticals.
Geography Analysis
North America generated 33.64% of global revenue in 2025 and should advance near 12.8% CAGR to 2031. U.S. EPA risk-management rules and OSHA process-safety mandates compel chemical and refinery operators to implement continuous condition monitoring. Canada's oil-sands producers, such as Suncor, trimmed steam ratios 7% using optimization, lowering carbon intensity and fuel bills. Mexico's export-oriented plants integrate predictive maintenance to hit 99.5% on-time delivery commitments for automakers.
Asia-Pacific is the fastest climber at 13.63% CAGR. China's 14th Five-Year Plan steers USD 1.4 trillion into smart factories, targeting 70% digitalization of large industrial firms by 2027. India's USD 1.5 trillion National Infrastructure Pipeline embeds asset-management specs into procurement, ensuring new ports and power plants launch with analytics baked in. Japan's Society 5.0 fuses cyber-physical tech with human-robot collaboration, while ASEAN nations replicate global best practices in fresh plants, bypassing legacy constraints.
Europe captured 24.1% of 2025 turnover and should rise at a roughly 12.5% CAGR. Platform Industrie 4.0's interoperability guides cut deployment costs up to 25%. The United Kingdom's GBP 1 billion (USD 1.27 billion) Industrial Decarbonization Strategy funds energy-intensive sectors adopting optimization. France's aging nuclear fleet relies on predictive analytics to justify license extensions, deferring USD 80 billion in capex. Middle East and Africa, led by Saudi Vision 2030, build optimization into mining and petrochemical capacity, while South America pilots remain cautious amid currency swings.
- International Business Machines Corporation
- General Electric Company
- Siemens AG
- ABB Ltd.
- Schneider Electric SE
- SAP SE
- Honeywell International Inc.
- Oracle Corporation
- Emerson Electric Co.
- Aspen Technology, Inc.
- Bentley Systems, Incorporated
- AVEVA Group plc
- DNV AS
- Uptake Technologies, Inc.
- Yokogawa Electric Corporation
- Rockwell Automation, Inc.
- PTC Inc.
- IPS-Intelligent Process Solutions GmbH
- Aktiebolaget SKF
- IFS AB
Additional Benefits:
- The market estimate (ME) sheet in Excel format
- 3 months of analyst support
TABLE OF CONTENTS
1 INTRODUCTION
- 1.1 Study Assumptions and Market Definition
- 1.2 Scope of the Study
2 RESEARCH METHODOLOGY
3 EXECUTIVE SUMMARY
4 MARKET LANDSCAPE
- 4.1 Market Overview
- 4.2 Market Drivers
- 4.2.1 Rapid Digitalization of Industrial Operations
- 4.2.2 Predictive Maintenance Focus to Reduce Unplanned Downtime
- 4.2.3 Compliance with Stringent Safety-Regulatory Frameworks
- 4.2.4 Rise of Industrial Internet of Things (IIoT) Platforms
- 4.2.5 Integration of Physics-Based Twins with AI Analytics
- 4.2.6 Carbon-Intensity KPIs Driving Asset Efficiency Programs
- 4.3 Market Restraints
- 4.3.1 High Upfront Capital Expenditure
- 4.3.2 Cyber-Security Vulnerabilities in Connected Assets
- 4.3.3 Shortage of In-House Data-Science Talent
- 4.3.4 Fragmented Brownfield Data Silos in Legacy Plants
- 4.4 Industry Value Chain Analysis
- 4.5 Regulatory Landscape
- 4.6 Technological Outlook
- 4.7 Porter's Five Forces Analysis
- 4.7.1 Bargaining Power of Suppliers
- 4.7.2 Bargaining Power of Buyers
- 4.7.3 Threat of New Entrants
- 4.7.4 Threat of Substitutes
- 4.7.5 Intensity of Competitive Rivalry
- 4.8 Assessment of Macroeconomic Trends on the Market
5 MARKET SIZE AND GROWTH FORECASTS (VALUE)
- 5.1 By Component
- 5.1.1 Software
- 5.1.2 Services
- 5.2 By Deployment Mode
- 5.2.1 On-Premise
- 5.2.2 Cloud
- 5.2.3 Hybrid
- 5.3 By Industry Vertical
- 5.3.1 Oil and Gas
- 5.3.2 Energy and Utilities
- 5.3.3 Manufacturing
- 5.3.4 Transportation and Logistics
- 5.3.5 Healthcare
- 5.3.6 Other Industry Verticals
- 5.4 By Enterprise Size
- 5.4.1 Large Enterprises
- 5.4.2 Small and Medium-Sized Enterprises (SMEs)
- 5.5 By Geography
- 5.5.1 North America
- 5.5.1.1 United States
- 5.5.1.2 Canada
- 5.5.1.3 Mexico
- 5.5.2 South America
- 5.5.2.1 Brazil
- 5.5.2.2 Argentina
- 5.5.2.3 Rest of South America
- 5.5.3 Europe
- 5.5.3.1 Germany
- 5.5.3.2 United Kingdom
- 5.5.3.3 France
- 5.5.3.4 Italy
- 5.5.3.5 Spain
- 5.5.3.6 Rest of Europe
- 5.5.4 Asia-Pacific
- 5.5.4.1 China
- 5.5.4.2 Japan
- 5.5.4.3 India
- 5.5.4.4 South Korea
- 5.5.4.5 ASEAN
- 5.5.4.6 Rest of Asia-Pacific
- 5.5.5 Middle East and Africa
- 5.5.5.1 Middle East
- 5.5.5.1.1 Saudi Arabia
- 5.5.5.1.2 United Arab Emirates
- 5.5.5.1.3 Turkey
- 5.5.5.1.4 Rest of the Middle East
- 5.5.5.2 Africa
- 5.5.5.2.1 South Africa
- 5.5.5.2.2 Nigeria
- 5.5.5.2.3 Rest of Africa
- 5.5.5.1 Middle East
- 5.5.1 North America
6 COMPETITIVE LANDSCAPE
- 6.1 Market Concentration
- 6.2 Strategic Moves
- 6.3 Market Share Analysis
- 6.4 Company Profiles (includes Global level Overview, Market level overview, Core Segments, Financials as available, Strategic Information, Market Rank/Share for key companies, Products and Services, and Recent Developments)
- 6.4.1 International Business Machines Corporation
- 6.4.2 General Electric Company
- 6.4.3 Siemens AG
- 6.4.4 ABB Ltd.
- 6.4.5 Schneider Electric SE
- 6.4.6 SAP SE
- 6.4.7 Honeywell International Inc.
- 6.4.8 Oracle Corporation
- 6.4.9 Emerson Electric Co.
- 6.4.10 Aspen Technology, Inc.
- 6.4.11 Bentley Systems, Incorporated
- 6.4.12 AVEVA Group plc
- 6.4.13 DNV AS
- 6.4.14 Uptake Technologies, Inc.
- 6.4.15 Yokogawa Electric Corporation
- 6.4.16 Rockwell Automation, Inc.
- 6.4.17 PTC Inc.
- 6.4.18 IPS-Intelligent Process Solutions GmbH
- 6.4.19 Aktiebolaget SKF
- 6.4.20 IFS AB
7 MARKET OPPORTUNITIES AND FUTURE OUTLOOK
- 7.1 White-space and Unmet-Need Assessment

