
PUBLISHER: Mordor Intelligence | PRODUCT CODE: 2063259

PUBLISHER: Mordor Intelligence | PRODUCT CODE: 2063259
Solar Panel Cleaning - Market Share Analysis, Industry Trends & Statistics, Growth Forecasts (2026 - 2031)
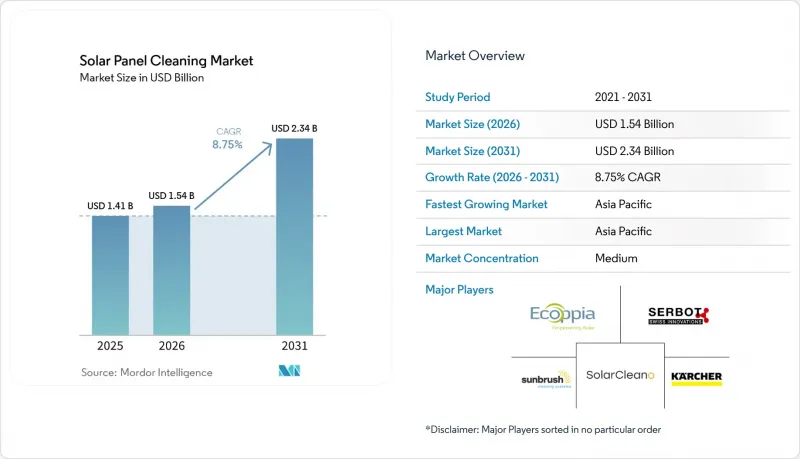
According to Mordor Intelligence, the solar panel cleaning market size is projected to expand from USD 1.41 billion in 2025 and USD 1.54 billion in 2026 to USD 2.34 billion by 2031, registering a CAGR of 8.75% between 2026 to 2031.
This report is Segmented by Cleaning Method (Wet, Dry, Electrostatic, Coating-Based), Technology Level (Manual, Semi-Automatic, Autonomous Robots, Drones), Deployment (Residential, Commercial & Industrial, Utility-Scale, Floating PV), Service Model (In-House, Third-Party, Raas), and Geography (North America, Europe, Asia-Pacific, South America, Middle East and Africa). Market Forecasts are in Value (USD).
Global Solar Panel Cleaning Market Trends and Insights
Rapid Utility-Scale PV Build-Outs in Arid Zones
Soiling losses of up to 70% in Saudi Arabia's Shuaibah and Sudair complexes have made frequent cleaning cycles financially critical, triggering contractual mandates in Rajasthan's 1 GW Pugal park that fine operators INR 6 per kWh for under-performance. Large arrays in Queensland and New South Wales battle dust storms that now justify 24/7 robotic fleets equipped with LiFePO4 batteries capable of climbing 20-degree slopes. The IEA estimates soiling erodes 4-7% of global PV output, equal to EUR 5 billion in lost revenue each year . Suppliers respond with terrain-adaptive tracks and lightweight composites that lower transport costs to remote desert sites. These innovations reinforce an ecosystem where automated cleaning protects power-purchase guarantees and underpins bankability for gigawatt-scale builds.
Stricter O&M Performance-Ratio Contracts
Generation thresholds embedded in West Bengal's 10 MW rooftop tender and Chile's 181.25 MWac ENGIE project force service providers to shoulder soiling risk, catalyzing demand for robots that capture and transmit photographic proof of every cleaning cycle. SECIs standardized O&M template now requires biweekly cleaning during monsoon and post-harvest dust peaks, aligning Indian practice with EU Renewable Energy Directive standards. Asset owners in Spain and Italy link incentive payments to real-time fleet data, compelling vendors to integrate cloud-based dashboards and predictive maintenance analytics. The net result is a performance-driven procurement environment where cleaning cadence, not just equipment price, determines contract awards.
High Capex of Fully-Autonomous Robots
Price tags of USD 50,000-150,000 per unit impose decade-long paybacks on 10 kW U.S. rooftops earning only USD 4,500 annually. Serbot's joystick-controlled PV Eco STANDARD eases cost barriers but still demands human presence, slowing adoption below the 50 kW threshold. BladeRanger, holding 18% segment revenue, focuses on multi-MW contracts where fleets amortize cost over scale. Rising interest rates and declining net-metering incentives kept U.S. residential solar installations down 31-32% in 2024, dampening demand for expensive automation. Leasing models and Robot-as-a-Service convert capex to opex, yet subscription fees remain uneconomic for scattered rooftop owners.
Other drivers and restraints analyzed in the detailed report include:
- Falling LCOE of Dry-Brush Robotic Systems
- PV Module Warranties Adding Anti-Soiling KPIs
- Skilled-Labor Shortages for Robot Fleet Servicing
For complete list of drivers and restraints, kindly check the Table Of Contents.
Segment Analysis
Dry-brush robots captured a growing share as wet cleaning retained 60.0% of the solar panel cleaning market size in 2025. High-pressure jet systems dominate coastal Spain, Italy, and the UAE, where salt films demand periodic rinsing, while Solaris Hydrobotics' water-motor robots consume only 0.5-1.5 liters per panel and thrive where water is plentiful yet grid power is absent .
Ecoppia's 3,900 MW of water-free deployments illustrate how eliminating tanker-truck logistics cuts operating expenses 30-40% in deserts. Triboelectric electrodynamic screens tested by Bluesky and Nomadd remove 90% of dust in seven minutes, offering a future zero-brush solution. Biodegradable agents from Chemitek enable drone spraying over agrivoltaic rows, blending wet and aerial techniques into a hybrid toolkit. As water prices surpass USD 5 per m3 in MENA, dry platforms are steadily eroding wet dominance, and the solar panel cleaning industry is witnessing procurement policies that now default to zero-water options for plants entering service after 2026.
Manual equipment still holds 50.2% of 2025 revenue in the solar panel cleaning market share, chiefly across residential and sub-MW rooftops where low labor costs outweigh efficiency gains . Semi-automatic trolleys bridge affordability gaps for Indian and Southeast Asian C&I sites with mixed roof angles.
Fully autonomous robots are scaling at an 11.4% CAGR, aided by GPS positioning accurate to +-10 cm, machine vision, and night-time operation that avoids thermal shock. FAA approval for multi-drone solar missions in 2025 positions aerial systems to complement ground crawlers on irregular terrain. EAUAV drones cleaning 8,000-10,000 m2 daily expand access to high-elevation arrays, while Infosys-Kaynes' Kleinbot targets compact roofs shaded by HVAC units. The solar panel cleaning industry as a whole is moving toward integrated fleets mixing ground robots and drones, accelerating the retirement of purely manual regimes.
Geography Analysis
Asia-Pacific accounted for 45.1% of global revenue in 2025 and is forecast to grow at 10.0% annually through 2031. China's module output of 289 GW and India's biweekly cleaning mandates anchor demand, while TrinaRobot's cross-row systems improved generation 8-15% across 152 MW in Albania and 100 MW in Malaysia. Japan, South Korea, and ASEAN nations added 41.4 GW of solar capacity in 2022, driving the uptake of portable robots suited to dense urban rooftops.
North America's utility-scale buildout surged 73% from 2021 to 2024 on the back of the Inflation Reduction Act, but residential installations fell 31-32% in 2024 as interest rates climbed. Desert states like Arizona and Sonora rely on dry-brush fleets to avoid USD 1,000-plus water-truck runs. Canada's Ontario and Alberta favor semi-automatic platforms that can double as snow-removal tools without violating module warranties.
Europe added 41.4 GW in 2022 and aims for 450 GWac under REPowerEU, with Spain's seasonal dust curtailing output up to 15% during dry spells. Hybrid regimes using dry robots for routine cycles and wet systems for deep cleans are now standard in Spain and Portugal. Nordic arrays prioritize soft-roller snow solutions, while Germany's feed-in tariffs spur rooftop growth, demanding lightweight portable equipment.
The Middle East and Africa experience the planet's worst soiling rates up to 0.9% per day,y making water-free robots essential. Saudi Arabia's Vision 2030 complexes employ Ecoppia fleets that reach 99.92% cleaning efficiency without a single liter of water. South Africa and Egypt follow suit as water scarcity converges with ambitious solar pipelines, reinforcing the region's status as a bellwether for dry-brush innovation.
- Ecoppia
- SunBrush mobil GmbH
- Karcher
- Serbot AG
- SolarCleano
- RST CleanTech
- Heliotex
- Sunpure Technology
- IPC Eagle
- PV Clean Mobile (USA)
- Clean Solar Industries
- KP Group
- TrinaRobot
- ChemiTek
- IFBOT Robotics
- Exosun
- Energy Robotics
- Aqua Solar Cleaners
- Limpeza Solar (Brazil)
- Muller Solar Services
Additional Benefits:
- The market estimate (ME) sheet in Excel format
- 3 months of analyst support
TABLE OF CONTENTS
1 Introduction
- 1.1 Study Assumptions & Market Definition
- 1.2 Scope of the Study
2 Research Methodology
3 Executive Summary
4 Market Landscape
- 4.1 Market Overview
- 4.2 Market Drivers
- 4.2.1 Rapid utility-scale PV build-outs in arid zones
- 4.2.2 Stricter O&M performance-ratio contracts
- 4.2.3 Falling LCOE of dry-brush robotic systems
- 4.2.4 PV module warranties adding anti-soiling KPIs
- 4.2.5 ESG-driven water-neutral O&M mandates
- 4.3 Market Restraints
- 4.3.1 High capex of fully-autonomous robots
- 4.3.2 Limited ROI for rooftops <50 kW
- 4.3.3 Regulatory gray-zones on micro-plastics from brush wear
- 4.3.4 Skilled-labor shortages for robot fleet servicing
- 4.4 Supply-Chain Analysis
- 4.5 Regulatory Landscape
- 4.6 Technological Outlook
- 4.7 Porter's Five Forces Analysis
- 4.7.1 Threat of New Entrants
- 4.7.2 Bargaining Power of Buyers
- 4.7.3 Bargaining Power of Suppliers
- 4.7.4 Threat of Substitutes
- 4.7.5 Competitive Rivalry
5 Market Size & Growth Forecasts
- 5.1 By Cleaning Method
- 5.1.1 Wet (Water-Fed Brush, High-Pressure Jet)
- 5.1.2 Dry (Rotary Brush, Air-Blast)
- 5.1.3 Electrostatic / Ionic
- 5.1.4 Coating-Based Self-Cleaning (Hydrophobic, Anti-Soiling)
- 5.2 By Technology Level
- 5.2.1 Manual Tools
- 5.2.2 Semi-Automatic (Trolley, Tractor-Mounted)
- 5.2.3 Fully-Autonomous Robots
- 5.2.4 Drone-Based Systems
- 5.3 By Deployment
- 5.3.1 Residential Rooftop (Up to 20 kW)
- 5.3.2 Commercial and Industrial (20 kW to 1 MW)
- 5.3.3 Utility-Scale (Above 1 MW)
- 5.3.4 Floating PV Arrays
- 5.4 By Service Model
- 5.4.1 In-House O&M Teams
- 5.4.2 Third-Party Cleaning Service Providers
- 5.4.3 Robot-as-a-Service (RaaS) Subscriptions
- 5.5 By Geography
- 5.5.1 North America
- 5.5.1.1 United States
- 5.5.1.2 Canada
- 5.5.1.3 Mexico
- 5.5.2 Europe
- 5.5.2.1 Germany
- 5.5.2.2 United Kingdom
- 5.5.2.3 France
- 5.5.2.4 Italy
- 5.5.2.5 NORDIC Countries
- 5.5.2.6 Russia
- 5.5.2.7 Rest of Europe
- 5.5.3 Asia-Pacific
- 5.5.3.1 China
- 5.5.3.2 India
- 5.5.3.3 Japan
- 5.5.3.4 South Korea
- 5.5.3.5 ASEAN Countries
- 5.5.3.6 Rest of Asia-Pacific
- 5.5.4 South America
- 5.5.4.1 Brazil
- 5.5.4.2 Argentina
- 5.5.4.3 Rest of South America
- 5.5.5 Middle East and Africa
- 5.5.5.1 Saudi Arabia
- 5.5.5.2 United Arab Emirates
- 5.5.5.3 South Africa
- 5.5.5.4 Egypt
- 5.5.5.5 Rest of Middle East and Africa
- 5.5.1 North America
6 Competitive Landscape
- 6.1 Market Concentration
- 6.2 Strategic Moves (M&A, Partnerships, PPAs)
- 6.3 Market Share Analysis (Market Rank/Share for key companies)
- 6.4 Company Profiles (includes Global level Overview, Market level overview, Core Segments, Financials as available, Strategic Information, Products & Services, and Recent Developments)
- 6.4.1 Ecoppia
- 6.4.2 SunBrush mobil GmbH
- 6.4.3 Karcher
- 6.4.4 Serbot AG
- 6.4.5 SolarCleano
- 6.4.6 RST CleanTech
- 6.4.7 Heliotex
- 6.4.8 Sunpure Technology
- 6.4.9 IPC Eagle
- 6.4.10 PV Clean Mobile (USA)
- 6.4.11 Clean Solar Industries
- 6.4.12 KP Group
- 6.4.13 TrinaRobot
- 6.4.14 ChemiTek
- 6.4.15 IFBOT Robotics
- 6.4.16 Exosun
- 6.4.17 Energy Robotics
- 6.4.18 Aqua Solar Cleaners
- 6.4.19 Limpeza Solar (Brazil)
- 6.4.20 Muller Solar Services
7 Market Opportunities & Future Outlook
- 7.1 White-space & Unmet-Need Assessment

