
PUBLISHER: Mordor Intelligence | PRODUCT CODE: 2063286

PUBLISHER: Mordor Intelligence | PRODUCT CODE: 2063286
3D Secure Pay Authentication - Market Share Analysis, Industry Trends & Statistics, Growth Forecasts (2026 - 2031)
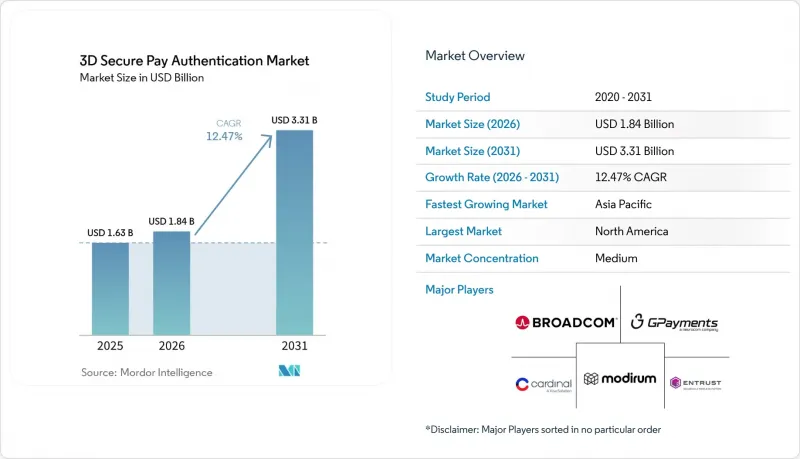
According to Mordor Intelligence, the 3D secure pay authentication market size is expected to grow from USD 1.63 billion in 2025 to USD 1.84 billion in 2026 and is forecast to reach USD 3.31 billion by 2031 at 12.47% CAGR over 2026-2031.
This report is Segmented by Component (Access Control Server, 3-D Secure Server and Merchant Plug-In, and More), Deployment Mode (On-Premises, Cloud-Based, and Hybrid), Authentication Flow Type (Frictionless Flow, and More), End User (Banks and Issuers, Merchants and Payment Gateways, Payment Service Providers, and More), and Geography. The Market Forecasts are Provided in Terms of Value (USD).
Global 3D Secure Pay Authentication Market Trends and Insights
Surge in E-Commerce and Card-Not-Present Fraud
Record USD 48 billion in e-commerce fraud during 2025 pushed card-not-present abuse to 73% of total card fraud, making strong customer authentication the primary loss-prevention lever. Chargeback fraud losses are projected at USD 28.1 billion during 2026, and every fraudulent dollar now costs U.S. merchants USD 4.61 when merchandise, shipping, and fees are included. EMV 3-D Secure liability shift rules place chargeback responsibility on issuers once authentication is declined, encouraging banks to raise challenge rates. Authenticated checkouts cut fraud-coded chargebacks by 60-80%, a return that offsets per-call fees of USD 0.05-0.15. Fraud escalation, therefore, fuels volume growth for 3D Secure Pay Authentication market providers while forcing them to balance security with friction-free experiences.
Regulatory Mandates Compress Compliance Timelines
Payment Services Directive 2 prevented an estimated EUR 20 billion (USD 22.3 billion) in European fraud, but narrower exemptions and issuer denial of low-risk requests now drive mandatory authentication volumes. India's September 2025 directions require at least one dynamic factor for every domestic transaction from April 2026, and issuers must reimburse customers for non-compliance losses. Brazil's Resolution 506 requires biometric confirmation for Pix transfers and device registration, increasing infrastructure spending among local institutions. Visa began penalizing acquirers in October 2025 when authentication rates fell below network thresholds, lifting U.S. authentication volume from January 2026 onward. Rules in multiple regions create a compliance floor beneath organic demand, accelerating the 3D Secure Pay Authentication market even where merchant adoption was previously discretionary.
Integration Cost and Complexity Deter Mid-Market Merchants
Per-authentication fees appear modest, yet small merchants face one-time integration projects, device testing, and ongoing dispute management that strain limited resources. Entersekt's Orkestrate promises 85% faster deployment and 98% frictionless logins, but adoption remains skewed toward tier-one banks. Regulatory mandates force even low-value transactions into strong customer authentication, pushing some sellers to lobby for risk-based exemptions that dilute fraud benefits. The cost-benefit gap narrows where average ticket values are high, yet many micro-merchants still choose to absorb chargebacks rather than risk abandonment. The drag on the 3D Secure Pay Authentication market is therefore most acute in fragmented long-tail segments.
Other drivers and restraints analyzed in the detailed report include:
- Migration to EMV 3-D Secure 2.x Unlocks Frictionless and Delegated Flows
- Mobile-Wallet and In-App Payment Boom Expands Authentication Surface
- Checkout Friction in Non-Mandate Regions Caps Voluntary Uptake
For complete list of drivers and restraints, kindly check the Table Of Contents.
Segment Analysis
SDK and Integration Services are set to capture a growing share of the 3D Secure Pay Authentication market revenue as issuers embed biometric and passkey flows natively in mobile apps. The 3D Secure Server and Merchant Plug-in category kept a 42.53% share in 2025, reflecting legacy installs, yet the preference is shifting toward modular software kits that speed device binding and reduce maintenance. Visa's Payment Passkey Service and Noon Payments' global launch illustrate the card network's intention to deliver plug-and-play FIDO2 through managed services, which supports the 12.91% forecast CAGR for SDK spend. Directory Servers retain their importance as routing components, yet most are bundled into broader orchestration platforms rather than sold standalone. Integration budgets are also flowing toward delegated authentication capability, letting merchants pre-score risk and call issuer Access Control Servers only when needed.
Cloud delivery models further catalyze growth. Utimaco's Payment HSM as a Service on IBM Cloud exemplifies a move away from capital-intensive hardware toward elastic cryptography functions. Mastercard token services now append authentication metadata, reducing the need for separate server calls and blurring the lines between tokenization and authentication components. As mobile-first markets such as India expect biometrics and passkeys to lift success rates 2-3 percentage points, SDK demand intensifies across fintech and Buy Now Pay Later platforms. Consequently, SDKs and orchestration tools reinforce the 3D Secure Pay Authentication market's momentum without adding checkout friction.
Cloud-based deployment accounted for 51.18% of the 3D Secure Pay Authentication market size in 2025 and will grow at 12.83% through 2031. Managed services such as Utimaco Payment HSM on IBM Cloud and Microsoft Azure Payment HSM remove the need for physical key-management hardware, opening enterprise-grade security to mid-tier issuers. Real-time machine learning models that calculate risk scores now update continuously in cloud environments, a feat hard to match on fixed on-premises appliances. Visa's Intelligent Authorization platform, launched in Europe during March 2026, pledges 99.999% uptime and 96.3% approval accuracy, metrics that showcase cloud resilience.
On-premises systems persist where data residency mandates require local processing, especially among regulated banks in South America and the Asia-Pacific. Hybrid architectures place event-stream analytics in the cloud while retaining key stores locally, offering a compliance bridge. Variable pricing further favors cloud: paying USD 0.05-0.15 per authentication on a usage basis is simpler than depreciating capital hardware over five years. Fraud surge and synthetic identity threats costing U.S. institutions up to USD 35 billion reinforce the need for scalable analytics, anchoring the cloud's leadership within the 3D Secure Pay Authentication market.
Geography Analysis
North America remained the revenue leader in 2025 with 40.55% share, as Visa and Mastercard interchange optimization, plus October 2025 performance penalties, drove issuers to authenticate a higher portion of e-commerce traffic. The region's abundant cloud infrastructure lets acquirers implement risk scoring quickly, and network token penetration exceeds any other global zone.
Asia-Pacific is the growth engine, with a 13.11% CAGR projected through 2031. India's April 2026 mandate for dynamic two-factor checks and China's booming cross-border e-commerce demand compel issuers to deploy EMV 3-D Secure 2.x at scale. More than 12.6 billion network tokens were active worldwide in 2026, with Asia-Pacific accounting for a disproportionate slice because mobile wallets dominate daily transactions. Authentication success gaps persist, however: India reached only 72% and Brazil 36% in 2026 compared with the United Kingdom's 95%, highlighting readiness disparities that vendors must bridge.
Europe enjoys the world's highest authentication success due to mature PSD2 rollouts, registering 95% in the United Kingdom, 93% in Italy, and 92% in the Netherlands. Continued tightening of transaction-risk analysis exemptions keeps volume elevated even in saturated markets. The Middle East and Africa and South America trail on absolute dollars but post step-change adoption as the United Arab Emirates and Saudi Arabia align rules with card-network standards, and Brazil's biometric Pix requirements escalate spend. Geographic divergence in issuer capabilities therefore shapes a multi-speed expansion path for the 3D Secure Pay Authentication market.
- GPayments Pty Ltd.
- CardinalCommerce Corporation
- Modirum Oy
- Broadcom Inc.
- Entrust Corporation
- RSA Security LLC
- Fiserv, Inc.
- Decta Limited
- Marqeta, Inc.
- Bluefin Payment Systems LLC
- Entersekt (Pty) Ltd.
- Thales Group
- Netcetera AG
- Worldline SA
- Adyen N.V.
- ACI Worldwide Inc.
- Mastercard Incorporated
- Visa Inc.
- American Express Company
- JCB Co., Ltd.
- Discover Financial Services
Additional Benefits:
- The market estimate (ME) sheet in Excel format
- 3 months of analyst support
TABLE OF CONTENTS
1 INTRODUCTION
- 1.1 Study Assumptions and Market Definition
- 1.2 Scope of the Study
2 RESEARCH METHODOLOGY
3 EXECUTIVE SUMMARY
4 MARKET LANDSCAPE
- 4.1 Market Overview
- 4.2 Impact of Macroeconomic Factors on the Market
- 4.3 Market Drivers
- 4.3.1 Surge In E-Commerce and Card-Not-Present Fraud
- 4.3.2 Regulatory Mandates (PSD2 SCA, India RBI, Brazil BCB)
- 4.3.3 Migration to EMV 3-D Secure 2. X Protocols
- 4.3.4 Mobile-Wallet and In-App Payment Boom
- 4.3.5 Webauthn and Passkey Integration
- 4.3.6 Cloud HSM-Powered Real-Time Risk Scoring
- 4.4 Market Restraints
- 4.4.1 Integration cost and complexity
- 4.4.2 Checkout friction in non-mandate regions
- 4.4.3 Inconsistent issuer readiness in EMs
- 4.4.4 Privacy rules limiting data-sharing (RbA)
- 4.5 Industry Value-Chain Analysis
- 4.6 Regulatory Landscape
- 4.7 Technological Outlook
- 4.8 Porter's Five Forces Analysis
- 4.8.1 Buyer Power
- 4.8.2 Supplier Power
- 4.8.3 Threat of Substitutes
- 4.8.4 Threat of New Entrants
- 4.8.5 Competitive Rivalry
5 MARKET SIZE AND GROWTH FORECASTS (VALUE)
- 5.1 By Component
- 5.1.1 Access Control Server (ACS)
- 5.1.2 3-D Secure Server / Merchant Plug-in
- 5.1.3 Directory Server
- 5.1.4 SDK and Integration Services
- 5.1.5 Other Component
- 5.2 By Deployment Mode
- 5.2.1 On-premises
- 5.2.2 Cloud-based
- 5.2.3 Hybrid
- 5.3 By Authentication Flow Type
- 5.3.1 Frictionless Flow
- 5.3.2 Challenge Flow
- 5.3.3 Out-of-Band / Decoupled Flow
- 5.3.4 Delegated Authentication
- 5.4 By End User
- 5.4.1 Banks / Issuers
- 5.4.2 Merchants and Payment Gateways
- 5.4.3 Payment Service Providers (PSPs)
- 5.4.4 FinTechs and BNPL Platforms
- 5.4.5 Other End User
- 5.5 By Geography
- 5.5.1 North America
- 5.5.1.1 United States
- 5.5.1.2 Canada
- 5.5.1.3 Mexico
- 5.5.2 Europe
- 5.5.2.1 Germany
- 5.5.2.2 United Kingdom
- 5.5.2.3 France
- 5.5.2.4 Italy
- 5.5.2.5 Rest of Europe
- 5.5.3 Asia-Pacific
- 5.5.3.1 China
- 5.5.3.2 Japan
- 5.5.3.3 India
- 5.5.3.4 South Korea
- 5.5.3.5 Australia
- 5.5.3.6 Rest of Asia-Pacific
- 5.5.4 South America
- 5.5.5 Middle East and Africa
- 5.5.1 North America
6 COMPETITIVE LANDSCAPE
- 6.1 Market Concentration
- 6.2 Strategic Moves
- 6.3 Market Share Analysis
- 6.4 Company Profiles (includes Global Level Overview, Market Level Overview, Core Segments, Financials as available, Strategic Information, Market Rank/Share, Products and Services, Recent Developments)
- 6.4.1 GPayments Pty Ltd.
- 6.4.2 CardinalCommerce Corporation
- 6.4.3 Modirum Oy
- 6.4.4 Broadcom Inc.
- 6.4.5 Entrust Corporation
- 6.4.6 RSA Security LLC
- 6.4.7 Fiserv, Inc.
- 6.4.8 Decta Limited
- 6.4.9 Marqeta, Inc.
- 6.4.10 Bluefin Payment Systems LLC
- 6.4.11 Entersekt (Pty) Ltd.
- 6.4.12 Thales Group
- 6.4.13 Netcetera AG
- 6.4.14 Worldline SA
- 6.4.15 Adyen N.V.
- 6.4.16 ACI Worldwide Inc.
- 6.4.17 Mastercard Incorporated
- 6.4.18 Visa Inc.
- 6.4.19 American Express Company
- 6.4.20 JCB Co., Ltd.
- 6.4.21 Discover Financial Services
7 MARKET OPPORTUNITIES AND FUTURE OUTLOOK
- 7.1 White-space and Unmet-need Assessment

