
PUBLISHER: Mordor Intelligence | PRODUCT CODE: 2063364

PUBLISHER: Mordor Intelligence | PRODUCT CODE: 2063364
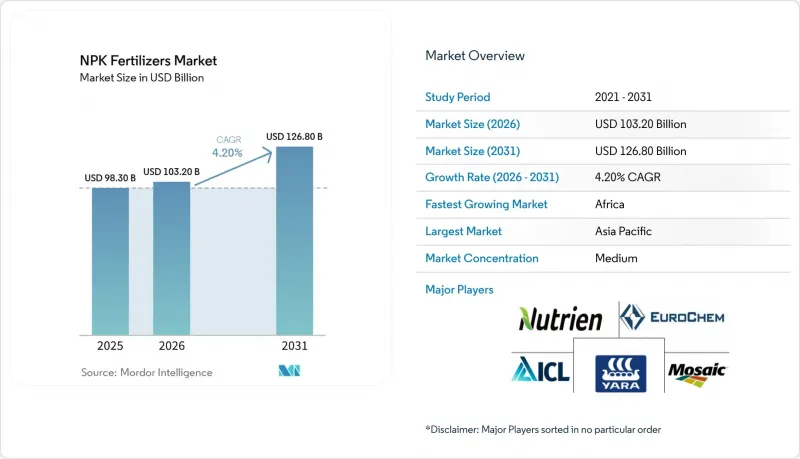
NPK Fertilizers - Market Share Analysis, Industry Trends & Statistics, Growth Forecasts (2026 - 2031)
According to Mordor Intelligence, the nPK fertilizers market size is projected to grow from USD 98.3 billion in 2025 and USD 103.2 billion in 2026 to USD 126.8 billion by 2031, registering a CAGR of 4.2% between 2026 and 2031.
This report is Segmented by Form (Dry/Granular, Liquid, and Water-Soluble Powder), by Crop Type (Cereals and Grains, Fruits and Vegetables, Oilseeds and Pulses, and Other Crops), by Mode of Application (Soil Broadcasting, Fertigation, Foliar Spray), and by Geography (North America, South America, Europe, Asia-Pacific, Middle East, and Africa). The Market Forecasts are Provided in Terms of Value (USD).
Global NPK Fertilizers Market Trends and Insights
Population-Driven Food-Demand Surge
Global fertilizer demand is steadily increasing as population growth places greater pressure on agricultural systems to achieve higher yields from limited arable land. According to the United Nations (UN), the global population is projected to reach 9.7 billion by 2050 . This population growth is directly impacting fertilizer consumption patterns, particularly for balanced NPK (Nitrogen, Phosphorus, and Potassium) products that promote sustainable crop productivity. Farmers are increasingly implementing nutrient-efficient practices to preserve soil fertility while addressing rising food demand amid environmental and land-use constraints.
Government Nutrient-Efficiency Incentives
Government initiatives are significantly contributing to the promotion of balanced fertilization and the enhancement of nutrient-use efficiency (NUE) in key agricultural economies. In India, the Nutrient Based Subsidy (NBS) scheme supports the use of phosphorus and potassium fertilizers, aiming to reduce the over-reliance on nitrogen-based inputs. These policies are shaping farmers' purchasing decisions toward NPK fertilizers with balanced nutrient compositions. As global sustainability regulations become more stringent, such measures are anticipated to drive the adoption of efficient fertilizer products and integrated nutrient management practices.
Potash and Ammonia Price Volatility
Fluctuations in ammonia-related fertilizer prices continue to impact cost structures in the NPK fertilizers market. According to the World Bank Commodity Markets, urea prices rose significantly from USD 472 per metric ton in February 2026 to USD 725.6 per metric ton in March 2026, indicating notable short-term volatility . Since urea is directly derived from ammonia, these price fluctuations underscore instability in nitrogen input costs, primarily influenced by changes in natural gas prices. This volatility increases production costs for NPK fertilizers, reduces affordability for farmers, and disrupts procurement cycles, ultimately resulting in inconsistent demand patterns across regions.
Other drivers and restraints analyzed in the detailed report include:
- Precision Fertilization Adoption
- Shift to Balanced NPK Blends in Specialty Crops
- Stricter Emission Rules on Urea Granulation Lines
For complete list of drivers and restraints, kindly check the Table Of Contents.
Segment Analysis
Liquid formulations led with the largest 61.3% of market share in 2025, supported by increasing adoption of fertigation systems that require fully soluble nutrients and uniform delivery. These products enable precise nutrient application and reduce losses during irrigation, making them suitable for high-value crops and controlled farming systems. Manufacturers are also improving storage, transport, and application infrastructure for liquids, including corrosion-resistant tanks and metering systems. This shift is reinforcing demand for liquid fertilizers, particularly in regions adopting precision agriculture practices and water-efficient farming techniques.
Dry/granular fertilizers remain essential for large-scale field crops due to ease of handling and cost efficiency. The dry/granular market size is projected to grow at the fastest 3.4% CAGR from 2026 to 2031 as producers invest in advanced granulation technologies and particle-size optimization. Uniform granules improve spreading accuracy and compatibility with variable rate equipment. Companies are upgrading coating and screening systems to reduce dust formation and enhance product consistency. Flexible manufacturing setups that support both liquid and granular formats are enabling producers to adapt to fluctuating demand and feedstock price dynamics.
Geography Analysis
Asia-Pacific is projected to hold the largest market share of 53.1% in 2025, driven by robust agricultural output and high fertilizer consumption in countries such as India and China. The region benefits from extensive arable land, multiple cropping cycles, and government initiatives promoting balanced fertilization. Expansion of domestic production capacity and integration across fertilizer value chains are enhancing supply stability. Additionally, the rising population and increasing food demand continue to fuel nutrient consumption, solidifying the region's leadership in global fertilizer usage.
Africa market size is projected to grow at the fastest CAGR of 5.8% from 2026 to 2031, driven by rising investments in fertilizer blending facilities and agricultural modernization. Governments and development organizations are actively promoting balanced fertilization to enhance soil health and crop productivity. The expansion of local production capacity is reducing reliance on imports and improving access to fertilizer. Growth in staple crop cultivation, coupled with supportive agricultural policies, is boosting demand for nutrient solutions across key African economies.
Europe and North America represent mature markets where demand is primarily driven by sustainability regulations and efficiency-focused farming practices. Environmental policies in these regions encourage optimized nutrient application while discouraging excessive fertilizer use. Farmers are increasingly adopting precision agriculture technologies and improved nutrient management practices. These trends are shaping purchasing behaviors and driving demand for high-efficiency, environmentally compliant fertilizer products. According to the International Fertilizer Association, global fertilizer demand reached approximately 201 million metric tons of nutrients in the 2024/25 fertilizer year, including 114 million metric tons of nitrogen, 47 million metric tons of phosphate, and 40 million metric tons of potash .
- Yara International ASA
- Nutrien Ltd.
- The Mosaic Company
- EuroChem Group AG
- ICL Group Ltd.
- CF Industries Holdings, Inc.
- OCP S.A.
- K+S Aktiengesellschaft
- Coromandel International Limited
- Borealis AG
- Haifa Group
- Kingenta Ecological Engineering Group Co., Ltd.
- Public Joint Stock Company Acron
- Stanley Agriculture Group Co., Ltd.
Additional Benefits:
- The market estimate (ME) sheet in Excel format
- 3 months of analyst support
TABLE OF CONTENTS
1 Introduction
- 1.1 Study Assumptions and Market Definition
- 1.2 Scope of the Study
2 Research Methodology
3 Executive Summary
4 Market Landscape
- 4.1 Market Overview
- 4.2 Market Drivers
- 4.2.1 Population-driven food-demand surge
- 4.2.2 Precision fertilization adoption
- 4.2.3 Shift to balanced NPK blends in specialty crops
- 4.2.4 Government nutrient-efficiency incentives
- 4.2.5 Carbon-credit revenue for low-nitrous-oxide NPKs
- 4.2.6 Phosphate recovery from wastewater plants
- 4.3 Market Restraints
- 4.3.1 Potash and ammonia price volatility
- 4.3.2 Stricter emission rules on urea granulation lines
- 4.3.3 Rapid acreage shift to pulses and legumes
- 4.3.4 Rise of biological N-P-K substitutes
- 4.4 Regulatory Landscape
- 4.5 Technological Outlook
- 4.6 Porter's Five Forces Analysis
- 4.6.1 Threat of New Entrants
- 4.6.2 Bargaining Power of Suppliers
- 4.6.3 Bargaining Power of Buyers
- 4.6.4 Threat of Substitutes
- 4.6.5 Intensity of Competitive Rivalry
5 Market Size and Growth Forecasts (Value, USD)
- 5.1 By Form
- 5.1.1 Dry/Granular
- 5.1.2 Liquid
- 5.1.3 Water-Soluble Powder
- 5.2 By Crop Type
- 5.2.1 Cereals and Grains
- 5.2.2 Fruits and Vegetables
- 5.2.3 Oilseeds and Pulses
- 5.2.4 Other Crops
- 5.3 By Mode of Application
- 5.3.1 Soil Broadcasting
- 5.3.2 Fertigation
- 5.3.3 Foliar Spray
- 5.4 By Geography
- 5.4.1 North America
- 5.4.1.1 United States
- 5.4.1.2 Canada
- 5.4.1.3 Mexico
- 5.4.1.4 Rest of North America
- 5.4.2 South America
- 5.4.2.1 Brazil
- 5.4.2.2 Argentina
- 5.4.2.3 Rest of South America
- 5.4.3 Europe
- 5.4.3.1 Germany
- 5.4.3.2 France
- 5.4.3.3 Russia
- 5.4.3.4 United Kingdom
- 5.4.3.5 Rest of Europe
- 5.4.4 Asia-Pacific
- 5.4.4.1 China
- 5.4.4.2 India
- 5.4.4.3 Japan
- 5.4.4.4 Australia
- 5.4.4.5 Rest of Asia-Pacific
- 5.4.5 Middle East
- 5.4.5.1 Saudi Arabia
- 5.4.5.2 Turkey
- 5.4.5.3 Rest of Middle East
- 5.4.6 Africa
- 5.4.6.1 Nigeria
- 5.4.6.2 South Africa
- 5.4.6.3 Rest of Africa
- 5.4.1 North America
6 Competitive Landscape
- 6.1 Market Concentration
- 6.2 Strategic Moves
- 6.3 Market Share Analysis
- 6.4 Company Profiles (Includes Global Level Overview, Market Level Overview, Core Segments, Financials as Available, Strategic Information, Market Rank/Share for Key Companies, Products and Services, and Recent Developments)
- 6.4.1 Yara International ASA
- 6.4.2 Nutrien Ltd.
- 6.4.3 The Mosaic Company
- 6.4.4 EuroChem Group AG
- 6.4.5 ICL Group Ltd.
- 6.4.6 CF Industries Holdings, Inc.
- 6.4.7 OCP S.A.
- 6.4.8 K+S Aktiengesellschaft
- 6.4.9 Coromandel International Limited
- 6.4.10 Borealis AG
- 6.4.11 Haifa Group
- 6.4.12 Kingenta Ecological Engineering Group Co., Ltd.
- 6.4.13 Public Joint Stock Company Acron
- 6.4.14 Stanley Agriculture Group Co., Ltd.
7 Market Opportunities and Future Outlook

