
PUBLISHER: Mordor Intelligence | PRODUCT CODE: 2063366

PUBLISHER: Mordor Intelligence | PRODUCT CODE: 2063366
Threat Modeling Tools - Market Share Analysis, Industry Trends & Statistics, Growth Forecasts (2026 - 2031)
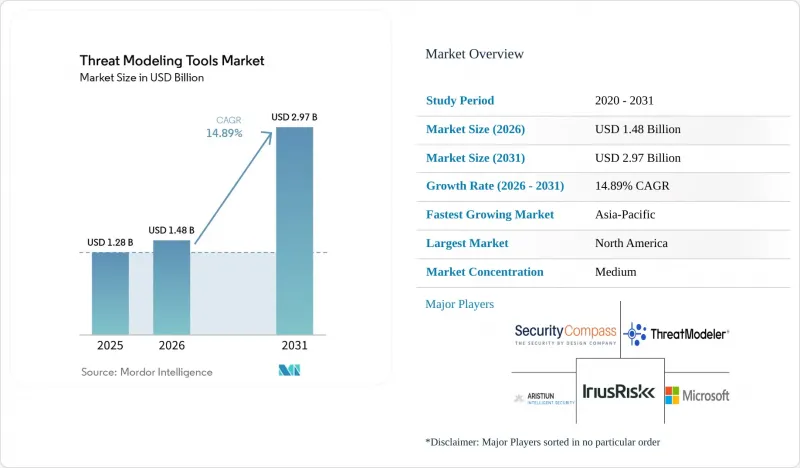
According to Mordor Intelligence, the threat modeling tools market size was valued at USD 1.28 billion in 2025 and is estimated to grow from USD 1.48 billion in 2026 to reach USD 2.97 billion by 2031, at a CAGR of 14.89% during the forecast period (2026-2031).
This report is Segmented by Deployment Mode (Cloud-Based, On-Premise, and Hybrid), Tool Type (Enterprise Commercial Platforms, Open-Source/Community Editions, and More), Organization Size (Large Enterprises, and Small and Medium-Sized Enterprises (SMEs)), End-User Vertical (BFSI, IT and Telecom, Manufacturing, and More), and Geography. The Market Forecasts are Provided in Terms of Value (USD).
Global Threat Modeling Tools Market Trends and Insights
Growing Regulatory Mandates For Secure Software Development
Governments are converting voluntary best practices into binding procurement criteria. The European Union's Cyber Resilience Act compels digital-product makers to document threat models across the product lifecycle, with full enforcement slated for September 2027. In the United States, Executive Order 14144 obliges federal software suppliers to self-attest against the NIST Secure Software Development Framework, elevating threat modeling to a baseline requirement. Brazil's draft Cybersecurity Legal Framework would create a national authority empowered to bar non-conforming vendors from public contracts. Saudi Arabia's Non-Critical National Infrastructure Cybersecurity Controls extend mandatory threat assessments to firms with as few as six employees. These statutes collectively expand the compliance-driven addressable base for the threat modeling tools market.
Surge In Cyberattacks Targeting Software Supply Chains
High-profile incidents prove that perimeter controls cannot contain transitive dependency risks. In March 2026, attackers back-doored the axios npm package, harvesting credentials from more than 18,000 downstream repositories. The TeamPCP campaign exploited trojanized Python artifacts to compromise build systems across multiple industries. The February 2024 Change Healthcare breach, triggered by compromised third-party credentials, disrupted prescription processing for over 100 million patients. These events are driving companies to adopt platforms that map dependencies, generate attack trees, and validate mitigations continuously, thereby fueling growth of the threat modeling tools market.
Lack Of Skilled Threat Modeling Professionals
The worldwide cybersecurity talent gap exceeds 3.5 million roles, and practitioners who can translate system designs into attack trees are rarer still. Gulf-region employers report that 87% struggle to hire qualified staff, prompting Saudi Arabia to launch programs that aim to train 20,000 specialists by 2030. Because platform automation cannot fully replace expert judgment, staffing shortages dampen adoption velocity, especially for complex operational-technology environments, limiting penetration of the threat modeling tools market.
Other drivers and restraints analyzed in the detailed report include:
- Shift-Left Security Adoption In DevSecOps Pipelines
- Increasing Integration With AI-Driven Code Generation Platformsdels
- High Initial Setup And Integration Costs
For complete list of drivers and restraints, kindly check the Table Of Contents.
Segment Analysis
Hybrid installations are projected to grow at a 15.44% CAGR to 2031 as regulated entities combine on-premise data custodianship with cloud scalability. Although cloud delivery held 53.52% of the threat modeling tools market share in 2025, national sovereignty rules in Saudi Arabia and the United Arab Emirates are steering workloads toward sovereign-cloud configurations that still rely on remote analytics. The threat modeling tools market size is consequently shifting toward vendors that synchronize models across environments without duplicating data.
Hybrid demand is reinforced by multi-cloud adoption, where assets reside in AWS, Azure, and Google Cloud yet must be evaluated through a single risk lens. Cisco's Splunk-anchored portfolio enables federated analytics across Amazon S3 and local log stores, illustrating how vendors capture spend when enterprises refuse to centralize sensitive telemetry. As such, hybrid capabilities are becoming a de-facto checklist item in large tenders, sustaining momentum for the threat modeling tools market.
Enterprise commercial suites retained 43.41% revenue share in 2025, due to policy engines, visual dashboards, and audit trails, yet they face rapid erosion from threat-as-code products that slot directly into Git workflows. The threat modeling tools market size for threat-as-code is expanding because security teams prefer YAML or JSON definitions that evolve with pull requests, aligning governance with the pace of infrastructure-as-code releases.
Open-source initiatives such as Threagile and OWASP Threat Dragon reduce experimental friction, especially for SMEs, whereas paid offerings differentiate through probabilistic attack graphs and quantitative risk scoring. Simulation tools like securiCAD model cascading failures across converged information-technology and operational-technology networks, addressing gaps that generic diagramming products cannot. This variety keeps the threat modeling tools market moderately fragmented yet highly innovative.
Geography Analysis
North America topped revenue at 39.11% in 2025, underpinned by mandatory federal self-attestation forms that list threat modeling as a prerequisite. Most leading vendors are headquartered in the United States, creating a dense local ecosystem of partners and consultants that accelerates platform rollouts. Canada's Critical Cyber Systems Protection Act extends similar obligations to telecommunications and energy operators, enlarging regional demand.
Europe follows with widespread uptake after the Cyber Resilience Act entered into force. Automotive, industrial, and consumer-electronics manufacturers in Germany, France, and Italy now consider threat modeling non-negotiable when placing products on the European market. Conformity-assessment deadlines for 2027 are prompting multi-year platform deals, contributing substantial revenue to the threat modeling tools market.
Asia-Pacific is the fastest-growing territory at a 16.13% CAGR. China amended its Cybersecurity Law to impose secure-development reviews on vendors serving critical infrastructure, India's Digital Personal Data Protection Act requires risk assessments for data fiduciaries, and Japan's revamped Cybersecurity Strategy stresses supply-chain assurance. Collectively, these directives open large addressable pools for providers fluent in local compliance dialects.
The Middle East and Africa region is emerging as a hybrid-cloud showcase. Saudi Arabia's SAR 203 million (USD 54.10 million) investment in DSShield and new licensing for managed security operations centers demonstrate national commitment to local expertise, while the United Arab Emirates earmarked over USD 2 billion for cybersecurity in its current budget. South America is following suit: Brazil's Resolution 538/2025 and pending cybersecurity bill institutionalize threat modeling for financial and public-sector systems, nudging the threat modeling tools market into fresh territory.
- ThreatModeler Software Inc.
- IriusRisk Limited
- Security Compass Inc.
- Foreseeti AB
- Aristiun Inc.
- CAIRIS Services Ltd.
- OWASP Foundation
- Microsoft Corporation
- Threagile UG
- ThreatSpec Ltd.
- Lucid Software Inc.
- Miro International GmbH
- Splunk Inc.
- Cisco Systems, Inc.
- SecureFlag Ltd.
- Tutamen GmbH
- Amazon Web Services, Inc.
- Kenna Security LLC
- International Business Machines Corporation
- Devici LLC
Additional Benefits:
- The market estimate (ME) sheet in Excel format
- 3 months of analyst support
TABLE OF CONTENTS
1 INTRODUCTION
- 1.1 Study Assumptions and Market Definition
- 1.2 Scope of the Study
2 RESEARCH METHODOLOGY
3 EXECUTIVE SUMMARY
4 MARKET LANDSCAPE
- 4.1 Market Overview
- 4.2 Market Drivers
- 4.2.1 Growing Regulatory Mandates for Secure Software Development
- 4.2.2 Surge in Cyberattacks Targeting Software Supply Chains
- 4.2.3 Shift-Left Security Adoption in DevSecOps Pipelines
- 4.2.4 Increasing Integration with AI-Driven Code Generation Platforms
- 4.2.5 Rise of Infrastructure-as-Code Threat Modeling Demand
- 4.2.6 Adoption of Threat Modeling Standards in Safety-Critical IoT Systems
- 4.3 Market Restraints
- 4.3.1 Lack of Skilled Threat Modeling Professionals
- 4.3.2 High Initial Setup and Integration Costs
- 4.3.3 Limited Support for Emerging Edge Computing Architectures
- 4.3.4 Fragmented Open-Source Alternatives Diluting Commercial Adoption
- 4.4 Industry Value Chain Analysis
- 4.5 Regulatory Landscape
- 4.6 Technological Outlook
- 4.7 Porter's Five Forces Analysis
- 4.7.1 Bargaining Power of Suppliers
- 4.7.2 Bargaining Power of Buyers
- 4.7.3 Threat of New Entrants
- 4.7.4 Threat of Substitutes
- 4.7.5 Intensity of Competitive Rivalry
- 4.8 Impact of Macroeconomic Factors on the Market
5 MARKET SIZE AND GROWTH FORECASTS (VALUE)
- 5.1 By Deployment Mode
- 5.1.1 Cloud-Based
- 5.1.2 On-Premise
- 5.1.3 Hybrid
- 5.2 By Tool Type
- 5.2.1 Enterprise Commercial Platforms
- 5.2.2 Open-Source / Community Editions
- 5.2.3 Threat-as-Code / CLI Tools
- 5.2.4 Diagramming-Centric Tools
- 5.2.5 Simulation and Attack-Graph Tools
- 5.3 By Organization Size
- 5.3.1 Large Enterprises
- 5.3.2 Small and Medium-Sized Enterprises (SMEs)
- 5.4 By End-User Vertical
- 5.4.1 BFSI
- 5.4.2 IT and Telecom
- 5.4.3 Healthcare and Life Sciences
- 5.4.4 Government and Defense
- 5.4.5 Retail and E-Commerce
- 5.4.6 Energy and Utilities
- 5.4.7 Manufacturing
- 5.4.8 Other End-User Verticals
- 5.5 By Geography
- 5.5.1 North America
- 5.5.1.1 United States
- 5.5.1.2 Canada
- 5.5.1.3 Mexico
- 5.5.2 Europe
- 5.5.2.1 Germany
- 5.5.2.2 United Kingdom
- 5.5.2.3 France
- 5.5.2.4 Italy
- 5.5.2.5 Rest of Europe
- 5.5.3 Asia-Pacific
- 5.5.3.1 China
- 5.5.3.2 Japan
- 5.5.3.3 India
- 5.5.3.4 South Korea
- 5.5.3.5 Australia
- 5.5.3.6 Rest of Asia-Pacific
- 5.5.4 Middle East and Africa
- 5.5.4.1 Middle East
- 5.5.4.1.1 Saudi Arabia
- 5.5.4.1.2 United Arab Emirates
- 5.5.4.1.3 Rest of the Middle East
- 5.5.4.2 Africa
- 5.5.4.2.1 South Africa
- 5.5.4.2.2 Egypt
- 5.5.4.2.3 Rest of Africa
- 5.5.4.1 Middle East
- 5.5.5 South America
- 5.5.5.1 Brazil
- 5.5.5.2 Argentina
- 5.5.5.3 Rest of South America
- 5.5.1 North America
6 COMPETITIVE LANDSCAPE
- 6.1 Market Concentration
- 6.2 Strategic Moves
- 6.3 Market Share Analysis
- 6.4 Company Profiles (includes Global level Overview, Market level overview, Core Segments, Financials as available, Strategic Information, Market Rank/Share for key companies, Products and Services, and Recent Developments)
- 6.4.1 ThreatModeler Software Inc.
- 6.4.2 IriusRisk Limited
- 6.4.3 Security Compass Inc.
- 6.4.4 Foreseeti AB
- 6.4.5 Aristiun Inc.
- 6.4.6 CAIRIS Services Ltd.
- 6.4.7 OWASP Foundation
- 6.4.8 Microsoft Corporation
- 6.4.9 Threagile UG
- 6.4.10 ThreatSpec Ltd.
- 6.4.11 Lucid Software Inc.
- 6.4.12 Miro International GmbH
- 6.4.13 Splunk Inc.
- 6.4.14 Cisco Systems, Inc.
- 6.4.15 SecureFlag Ltd.
- 6.4.16 Tutamen GmbH
- 6.4.17 Amazon Web Services, Inc.
- 6.4.18 Kenna Security LLC
- 6.4.19 International Business Machines Corporation
- 6.4.20 Devici LLC
7 MARKET OPPORTUNITIES AND FUTURE OUTLOOK
- 7.1 White-space and Unmet-Need Assessment

