PUBLISHER: Mordor Intelligence | PRODUCT CODE: 2063441

PUBLISHER: Mordor Intelligence | PRODUCT CODE: 2063441
Polyethylene Terephthalate (PET) Fiber - Market Share Analysis, Industry Trends & Statistics, Growth Forecasts (2026 - 2031)
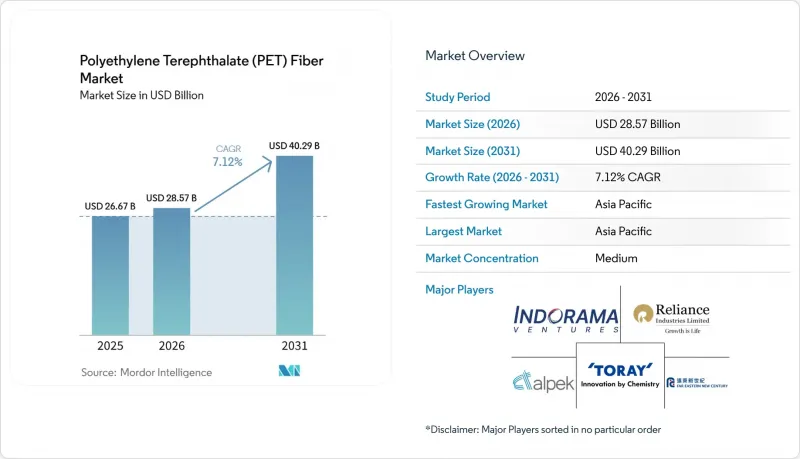
According to Mordor Intelligence, the polyethylene terephthalate fiber market size is expected to increase from USD 26.67 billion in 2025 to USD 28.57 billion in 2026 and reach USD 40.29 billion by 2031, growing at a CAGR of 7.12% over 2026-2031.
This report is Segmented by Product Type (Staple Fiber and Filament Fiber), Application (Textiles, Bottles, Films, Automotive, Electronics, and Others), End-User (Apparel, Home Furnishing, Industrial, and Others), and Geography (Asia-Pacific, North America, Europe, South America, Middle-East and Africa). The Market Forecasts are Provided in Terms of Value (USD).
Global Polyethylene Terephthalate (PET) Fiber Market Trends and Insights
Cost Advantage and Versatility of PET Fibers
PET's melt-spinning route circumvents water-intensive ginning and carding, lowering installed-capacity capex by roughly 40% versus cotton systems. Competitive delivered costs let converters price staple below cotton-polyester blends in furnishings and industrial cloth, while chemical inertness and UV stability widen use in geotextiles and filtration. Copolymer tweaks, adding isophthalic acid or diethylene glycol, shift glass-transition temperature and dye affinity without new hardware, enabling quick grade changes for diverse markets. Because the same extruders produce both staple and filament, plants flex capacity toward whichever grade commands better margins, further reinforcing PET's cost moat.
Rising Demand for Performance Textiles and Activewear
Brands now mandate micro-denier filaments (1.0-1.5 denier per filament [dpf]) that create a softer hand and four-way stretch when co-knit with elastane. Hollow or channeled cross-sections in COOLMAX-type yarns supply moisture management with no weight penalty, prized by outdoor and military programs. Mechanically recycled REPREVE yarn already represented 31% of Unifi's FY 2025 sales and targeted more than 50% by 2030. EU Ecodesign rules entering into force in 2028 add further pull by requiring traceable recycled content, compelling mills to lock in recycled PET (rPET) supply.
Crude-Linked Feedstock Price Volatility
Purified Terephthalic Acid (PTA) and Monoethylene Glycol (MEG) track with a lag, so Brent's early-2025 rally squeezed Chinese filament margins to multi-year lows. PTA-paraxylene spreads collapsed to USD 80 per ton mid-2025 as new Asian capacity outpaced demand, forcing high-cost spinners into turnarounds. Futures hedges help, yet Brent-PTA basis swings of USD 30 per ton undermine perfect cover, pressing firms toward deeper integration.
Other drivers and restraints analyzed in the detailed report include:
- Recycled-Content Mandates Boost Fiber Uptake
- Expansion of Technical and Industrial Applications
- Competition from Cotton and Bio-based Alternatives
For complete list of drivers and restraints, kindly check the Table Of Contents.
Segment Analysis
In 2025, staple fiber held a commanding 57.84% share of the market. Meanwhile, filament fiber is projected to grow at a 7.62% compound annual growth rate (CAGR) from 2026 to 2031, driven by its applications in airbags, seatbelts, and tire cords, all of which demand a failure tolerance of less than 1 part per million (ppm). In 2025, China introduced an additional 1.83 million tons per year (Mt/y) of partially oriented yarn (POY), primarily channeling it into draw-textured yarns for upholstery and technical fabrics. Concurrently, Filatex India is gearing up for 2026 with plans for 62 kilotons per year across its partially oriented yarn (POY), fully drawn yarn (FDY), and draw-textured yarn (DTY) lines. Filament fiber boasts lower conversion costs compared to staple fiber and minimizes cutting waste, enhancing its profit margins. On the downstream side, continuous-filament weavers are securing original equipment manufacturer (OEM) certifications, effectively sidelining competitors for contract durations of three to five years, bolstering their growth trajectory.
While staple fiber remains the go-to choice for apparel blends and home furnishings, thanks to ring and rotor systems fine-tuned for specific cuts, its growth rate is trailing behind that of filament fiber. This is particularly evident as cotton makes a comeback in leisurewear. Specialty staple varieties, including cationic-dyeable, flame-retardant, and hollow fibers, not only command a higher value but also underpin the limited new capacities emerging in the West. Beginning in 2028, the EU's Digital Product Passports mandate will enhance traceability for filament fibers, especially in contrast to multi-fiber staple yarns. Such a development is poised to channel more investments into continuous assets.
Geography Analysis
Asia-Pacific, accounting for 62.58% of 2025 revenue, is set to grow at a 7.94% CAGR from 2026 to 2031. China, with a significant share of the global filament capacity, stands as the dominant player. In a notable development, Tongkun is making a substantial investment to expand its production of green differentiated fiber. Meanwhile, India is advancing with Reliance's upcoming polyester-fiber line and Filatex's planned expansion of partially oriented yarn (POY), both expected to commence operations in 2026. Looking ahead to 2029, Brunei's Phase II aims to enhance its production of purified terephthalic acid (PTA) and polyethylene terephthalate (PET), leveraging its advantage of low-cost gas feedstock.
Despite facing high energy prices and regulatory costs, Europe and North America continue to attract niche investments. In early 2025, Alpek restarted a PET facility in the UK to enhance production capacity. On the Gulf Coast, credits from the Inflation Reduction Act are providing a modest boost to capacity. European mills are pivoting, now focusing on recycled filament and outsourcing virgin grades to Thailand. In a strategic expansion, Teijin increased its high-tenacity recycled capacity in Thailand in 2025. While South America and the Middle-East and Africa play minor roles currently, they are poised to benefit from Saudi infrastructure projects and Brazilian mining activities, both of which have a significant demand for PET geotextiles and conveyor belts.
- Alpek S.A.B. de C.V.
- Barnet
- China Petroleum & Chemical Corporation.
- DAK Americas LLC
- Far Eastern New Century Corporation
- HYOSUNG
- Indorama Ventures Public Company Limited
- Kolon Industries, Inc.
- Lotte Chemical Corporation
- NAN YA PLASTICS CORPORATION
- Reliance Industries Limited
- SHINKONG SYNTHETIC FIBERS CORP.
- TEIJIN LIMITED.
- Tongkun Group Co., Ltd.
- Toray Advanced Composites (Toray Industries, Inc.)
- UNIFI, Inc.,
- Wellman International
- Zhejiang Hengyi Group Co., Ltd.
Additional Benefits:
- The market estimate (ME) sheet in Excel format
- 3 months of analyst support
TABLE OF CONTENTS
1 Introduction
- 1.1 Study Assumptions and Market Definition
- 1.2 Scope of the Study
2 Research Methodology
3 Executive Summary
4 Market Landscape
- 4.1 Market Overview
- 4.2 Market Drivers
- 4.2.1 Cost Advantage and Versatility of PET Fibers
- 4.2.2 Rising Demand for Performance Textiles and Activewear
- 4.2.3 Recycled-Content Mandates Boost Fiber Uptake
- 4.2.4 Expansion of Technical and Industrial Applications
- 4.2.5 AI-Enabled Spinning Control Enhancing Yield and Quality
- 4.3 Market Restraints
- 4.3.1 Crude-Linked Feedstock Price Volatility
- 4.3.2 Competition from Cotton and Bio-based Alternatives
- 4.3.3 rPET Bottle-to-Bottle Demand Squeezing Fiber Feedstock
- 4.4 Value Chain Analysis
- 4.5 Porter's Five Forces
- 4.5.1 Bargaining Power of Suppliers
- 4.5.2 Bargaining Power of Buyers
- 4.5.3 Threat of Substitution
- 4.5.4 Threat of New Entrants
- 4.5.5 Competitive Rivalry
5 Market Size and Growth Forecasts (Value)
- 5.1 By Product Type
- 5.1.1 Staple Fiber
- 5.1.2 Filament Fiber
- 5.2 By Application
- 5.2.1 Textiles
- 5.2.2 Bottles
- 5.2.3 Films
- 5.2.4 Automotive
- 5.2.5 Electronics
- 5.2.6 Others
- 5.3 By End-User
- 5.3.1 Apparel
- 5.3.2 Home Furnishing
- 5.3.3 Industrial
- 5.3.4 Others
- 5.4 By Geography
- 5.4.1 Asia-Pacific
- 5.4.1.1 China
- 5.4.1.2 India
- 5.4.1.3 Japan
- 5.4.1.4 South Korea
- 5.4.1.5 ASEAN Countries
- 5.4.1.6 Rest of Asia-Pacific
- 5.4.2 North America
- 5.4.2.1 United States
- 5.4.2.2 Canada
- 5.4.2.3 Mexico
- 5.4.3 Europe
- 5.4.3.1 Germany
- 5.4.3.2 United Kingdom
- 5.4.3.3 France
- 5.4.3.4 Italy
- 5.4.3.5 Spain
- 5.4.3.6 Russia
- 5.4.3.7 Rest of Europe
- 5.4.4 South America
- 5.4.4.1 Brazil
- 5.4.4.2 Argentina
- 5.4.4.3 Rest of South America
- 5.4.5 Middle-East and Africa
- 5.4.5.1 Saudi Arabia
- 5.4.5.2 South Africa
- 5.4.5.3 Rest of Middle-East and Africa
- 5.4.1 Asia-Pacific
6 Competitive Landscape
- 6.1 Market Concentration
- 6.2 Strategic Moves
- 6.3 Market Share(%)/Ranking Analysis
- 6.4 Company Profiles (includes Global level Overview, Market level overview, Core Segments, Financials as available, Strategic Information, Products and Services, and Recent Developments)
- 6.4.1 Alpek S.A.B. de C.V.
- 6.4.2 Barnet
- 6.4.3 China Petroleum & Chemical Corporation.
- 6.4.4 DAK Americas LLC
- 6.4.5 Far Eastern New Century Corporation
- 6.4.6 HYOSUNG
- 6.4.7 Indorama Ventures Public Company Limited
- 6.4.8 Kolon Industries, Inc.
- 6.4.9 Lotte Chemical Corporation
- 6.4.10 NAN YA PLASTICS CORPORATION
- 6.4.11 Reliance Industries Limited
- 6.4.12 SHINKONG SYNTHETIC FIBERS CORP.
- 6.4.13 TEIJIN LIMITED.
- 6.4.14 Tongkun Group Co., Ltd.
- 6.4.15 Toray Advanced Composites (Toray Industries, Inc.)
- 6.4.16 UNIFI, Inc.,
- 6.4.17 Wellman International
- 6.4.18 Zhejiang Hengyi Group Co., Ltd.
7 Market Opportunities and Future Outlook
- 7.1 White-space and Unmet-Need Assessment

