
PUBLISHER: Mordor Intelligence | PRODUCT CODE: 2063446

PUBLISHER: Mordor Intelligence | PRODUCT CODE: 2063446
Rheumatology Therapeutics - Market Share Analysis, Industry Trends & Statistics, Growth Forecasts (2026 - 2031)
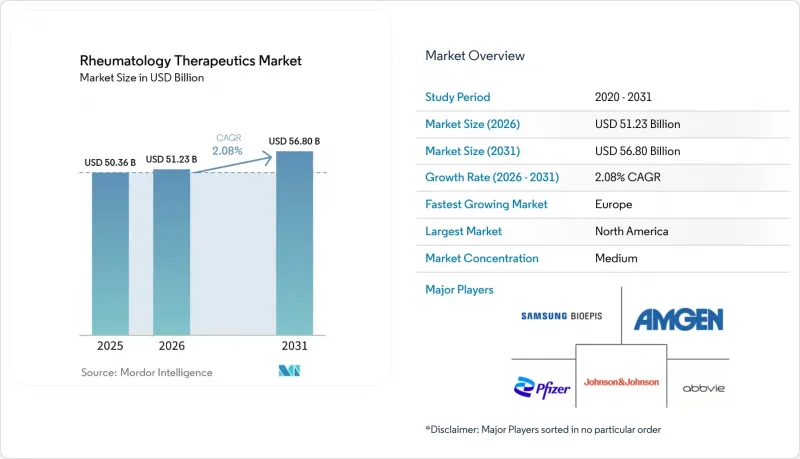
According to Mordor Intelligence, the rheumatology therapeutics market size is expected to increase from USD 50.36 billion in 2025 to USD 51.23 billion in 2026 and reach USD 56.80 billion by 2031, growing at a CAGR of 2.08% over 2026-2031.
This report is Segmented by Indication (Rheumatoid Arthritis, Psoriatic Arthritis, and More) Drug Class (Conventional Synthetic DMARDs, Biologic DMARDs, Targeted Synthetic DMARDs, and More), Route of Administration (Oral, Intravenous), Distribution Channel (Hospital Pharmacies and More) and Geography (North America, Europe, and More). The Market Forecasts are Provided in Terms of Value (USD).
Global Rheumatology Therapeutics Market Trends and Insights
Rising Autoimmune Disease Burden and Aging Patient Populations
Incidence of rheumatoid arthritis climbs steeply beyond age 50; concomitant surges in psoriatic arthritis and axial spondyloarthritis reflect better imaging and biomarker use. The World Health Organization projects a global cohort of 2.1 billion people aged 60 plus by 2050, doubling 2020 levels . Although this enlarges the eligible pool, older patients accumulate cardiovascular and malignancy risks that limit JAK inhibitor prescribing under FDA boxed warnings, pushing clinicians toward csDMARDs and lower-intensity regimens. Payers reinforce this caution by mandating methotrexate failure before biologic approval, extending time to optimal disease control. These constraints temper uptake of premium therapy even as the population base expands.
Accelerating Adoption of Biologics and Biosimilars in Rheumatology
Biosimilar interchangeability has disrupted pricing. Simlandi was the first to receive an adalimumab interchangeability label in February 2024, followed by Hadlima and Yuflyma in 2025, enabling pharmacist substitution without prescriber consent . Evernorth data show that Humira biosimilars accounted for a significant share of adalimumab prescriptions by Q4 2024 and overtook the originator in Q1 2025. Net prices have fallen significantly, broadening access but compressing margins. FDA draft guidance (October 2025) proposes waiving comparative efficacy trials when analytical similarity suffices, potentially cutting biosimilar development timelines in half, a boon for integrated developers such as Samsung Bioepis and Celltrion.
Price Erosion and Payer Pressure from Rapid Biosimilar Diffusion
Humira biosimilars achieved high prescription share by Q4 2024, overtaking the originator a quarter later as PBMs mandated biosimilar-first protocols. Comparable erosion looms for tocilizumab and etanercept as new biosimilars secure FDA and EMA green lights in 2025-2026. Originators counter with deeper rebates and copay assistance, but net prices keep sliding, weighing on topline growth in high-income markets.
Other drivers and restraints analyzed in the detailed report include:
- Expansion of Targeted Small Molecules (JAK/TYK2) Across RA, PsA, axSpA
- Favorable Reimbursement and Clinical Guideline Alignment for Treat-to-Target
- Safety Headwinds for JAK Class (Boxed Warnings, Label Restrictions)
For complete list of drivers and restraints, kindly check the Table Of Contents.
Segment Analysis
Rheumatoid arthritis retained 38.78% of the rheumatology therapeutics market share in 2025, yet its margin has narrowed as adalimumab biosimilars won a significant share of U.S. prescriptions by Q4 2024 and the majority in China during 2024, compressing originator pricing. Psoriatic arthritis accounts for a smaller share today, but it is forecast to grow at a 4.12% CAGR to 2031-more than double the rate of mature RA, making it the fastest-advancing indication within the rheumatology therapeutics market. AbbVie's Skyrizi secured U.S. approval for psoriatic arthritis in June 2024 and posted USD 3.2 billion in Q3 2024 revenue, up significantly year-over-year, confirming robust demand for IL-23 inhibition across joint and skin disease.
Conventional synthetic DMARDs accounted for 20.34% of the rheumatology therapeutics market share in 2025, as guidelines still require methotrexate failure before escalating therapy. Methotrexate costs less than USD 20 per month, sustaining high volumes, though 30-40% of patients fail to meet response goals-so it keeps a durable floor under the rheumatology therapeutics market. Targeted synthetics, led by JAK inhibitors, are projected to expand at a 3.45% CAGR to 2031, the fastest among drug classes, yet boxed warnings on cardiovascular and malignancy risks limit use to younger, lower-risk patients. AbbVie's Rinvoq generated USD 1.8 billion in Q3 2024, a 46% surge that underlines demand for convenient oral options across RA, PsA, and axial spondyloarthritis despite payer step therapy. Pfizer withdrew new-indication work on tofacitinib after patent expiry in 2024, effectively conceding the oral DMARD lane to newer rivals.
Geography Analysis
North America led the rheumatology therapeutics market in 2025 with a 39.34% share, but interchangeability rulings for adalimumab biosimilars and looming Medicare price negotiations are expected to cap future growth. The 2025 Part D redesign places a USD 2,000 ceiling on patient out-of-pocket costs, shifting more liability to plans and stimulating tougher formulary management. Canada's bulk-buying alliance and Mexico's public insurers echo this down-pricing trend, compelling manufacturers to seek volume via new indications rather than price lifts. Canada's pan-Canadian Pharmaceutical Alliance and Mexico's IMSS and ISSSTE supplement the region's volume by jointly negotiating biologic prices to ease budget pressure.
Europe is projected to expand at a 4.34% CAGR through 2031, the fastest among all regions, as national health systems embed mandatory switching targets and streamline approvals. Germany's AMNOG framework aligns prices with assessed clinical benefit; France's 2025 plan rewards prescribers who meet an 80% biosimilar quota for adalimumab and etanercept; and the United Kingdom's cost-per-QALY threshold consistently steers payers toward lower-priced options.
Asia-Pacific shows the next wave of expansion, propelled by China's dual-catalog National Reimbursement Drug List that cut average prices 63% for 114 drugs while preserving premium pricing for 19 breakthrough therapies starting January 2026. Domestic manufacturers already control most Chinese volume, with adalimumab biosimilars capturing majority share in 2024, tocilizumab, and infliximab held notable volume as list prices fall but margins stay positive. Japan's National Health Insurance offers a JPY 1,500 (USD 10) dispensing bonus for select biosimilars, a policy that produced a 13.48% one-time jump in etanercept uptake and now extends to ustekinumab after its May 2025 listing. India's market was valued at INR 437 crore (USD 51 million) in 2025 and is set for a 14.2% CAGR, underpinned by the USD 1.1 billion Biopharma SHAKTI program that scales low-cost manufacturing for export to regulated market.
Middle East & Africa and South America expand more slowly because reimbursement gaps and currency volatility curb multinational investment. Gulf Cooperation Council states are building specialty pharmacy networks and using volume-based contracts to narrow price spreads, while South Africa's tender system awards business almost exclusively to the lowest bidder, putting biosimilars in pole position. Brazil's public system limits biologic access mainly to wealthier patients with private insurance, creating a two-tier market, and Argentina's currency slide in 2024 forces repeated price renegotiations that deter long-term capacity commitments.
- Abbvie
- Amgen
- Biocon Biologics
- Bristol-Myers Squibb Company
- Celltrion Healthcare
- Eli Lilly and Company
- F. Hoffmann-La Roche Ltd.
- Fresenius
- Gilead Sciences
- Johnson & Johnson
- Novartis
- Pfizer
- Samsung Bioepis
- Sanofi
- UCB
Additional Benefits:
- The market estimate (ME) sheet in Excel format
- 3 months of analyst support
TABLE OF CONTENTS
1 Introduction
- 1.1 Study Assumptions & Market Definition
- 1.2 Scope of the Study
2 Research Methodology
3 Executive Summary
4 Market Landscape
- 4.1 Market Overview
- 4.2 Market Drivers
- 4.2.1 Rising Autoimmune Disease Burden and Aging Patient Populations
- 4.2.2 Accelerating Adoption of Biologics and Biosimilars in Rheumatology
- 4.2.3 Expansion of Targeted Small Molecules (JAK/TYK2) Across RA, Psa, Axspa
- 4.2.4 Favorable Reimbursement and Clinical Guideline Alignment for Treat-To-Target
- 4.2.5 Interchangeability Designations Accelerate US Biosimilar Uptake
- 4.2.6 Shift To Home/Self-Administration Via SC Autoinjectors And On-Body Devices
- 4.3 Market Restraints
- 4.3.1 Price Erosion and Payer Pressure from Rapid Biosimilar Diffusion
- 4.3.2 Safety Headwinds for Jak Class (Boxed Warnings, Label Restrictions)
- 4.3.3 High Out-Of-Pocket Costs and Utilization Management (Step Therapy, Accumulators)
- 4.3.4 Channel Consolidation into PBM-Owned Specialty Networks Limits Choice
- 4.4 Supply-Chain Analysis
- 4.5 Regulatory Landscape
- 4.6 Technological Outlook
- 4.7 Porter's Five Forces
- 4.7.1 Threat of New Entrants
- 4.7.2 Bargaining Power of Suppliers
- 4.7.3 Bargaining Power of Buyers
- 4.7.4 Threat of Substitutes
- 4.7.5 Industry Rivalry
5 Market Size & Growth Forecasts (Value, USD)
- 5.1 By Indication
- 5.1.1 Rheumatoid Arthritis (RA)
- 5.1.2 Psoriatic Arthritis (PsA)
- 5.1.3 Axial Spondyloarthritis (incl. Ankylosing Spondylitis)
- 5.1.4 Systemic Lupus Erythematosus (SLE)
- 5.1.5 Gout
- 5.1.6 Sjogren's Syndrome
- 5.1.7 Systemic Sclerosis (Scleroderma)
- 5.1.8 Vasculitides (e.g., GPA/MPA)
- 5.1.9 Juvenile Idiopathic Arthritis (JIA)
- 5.2 By Drug Class
- 5.2.1 Conventional Synthetic DMARDs (csDMARDs)
- 5.2.2 Biologic DMARDs (bDMARDs)
- 5.2.3 Targeted Synthetic DMARDs (tsDMARDs)
- 5.2.4 Symptomatic Agents
- 5.3 By Route of Administration
- 5.3.1 Oral
- 5.3.2 Intravenous
- 5.4 By Distribution Channel
- 5.4.1 Hospital Pharmacies
- 5.4.2 Retail Pharmacies
- 5.4.3 Others
- 5.5 By Geography
- 5.5.1 North America
- 5.5.1.1 United States
- 5.5.1.2 Canada
- 5.5.1.3 Mexico
- 5.5.2 Europe
- 5.5.2.1 Germany
- 5.5.2.2 United Kingdom
- 5.5.2.3 France
- 5.5.2.4 Italy
- 5.5.2.5 Spain
- 5.5.2.6 Rest of Europe
- 5.5.3 Asia-Pacific
- 5.5.3.1 China
- 5.5.3.2 India
- 5.5.3.3 Japan
- 5.5.3.4 South Korea
- 5.5.3.5 Australia
- 5.5.3.6 Rest of Asia-Pacific
- 5.5.4 Middle East and Africa
- 5.5.4.1 GCC
- 5.5.4.2 South Africa
- 5.5.4.3 Rest of Middle East and Africa
- 5.5.5 South America
- 5.5.5.1 Brazil
- 5.5.5.2 Argentina
- 5.5.5.3 Rest of South America
- 5.5.1 North America
6 Competitive Landscape
- 6.1 Market Concentration
- 6.2 Market Share Analysis
- 6.3 Company Profiles {(includes Global level Overview, Market level overview, Core Segments, Financials as available, Strategic Information, Market Rank/Share for key companies, Products & Services, and Recent Developments)}
- 6.3.1 AbbVie Inc.
- 6.3.2 Amgen Inc.
- 6.3.3 Biocon Biologics
- 6.3.4 Bristol-Myers Squibb Company
- 6.3.5 Celltrion Healthcare
- 6.3.6 Eli Lilly and Company
- 6.3.7 F. Hoffmann-La Roche Ltd.
- 6.3.8 Fresenius Kabi
- 6.3.9 Gilead Sciences, Inc.
- 6.3.10 Johnson & Johnson
- 6.3.11 Novartis AG
- 6.3.12 Pfizer Inc.
- 6.3.13 Samsung Bioepis
- 6.3.14 Sanofi
- 6.3.15 UCB S.A.
7 Market Opportunities & Future Outlook
- 7.1 White-space & unmet-need assessment

