
PUBLISHER: Mordor Intelligence | PRODUCT CODE: 2063544

PUBLISHER: Mordor Intelligence | PRODUCT CODE: 2063544
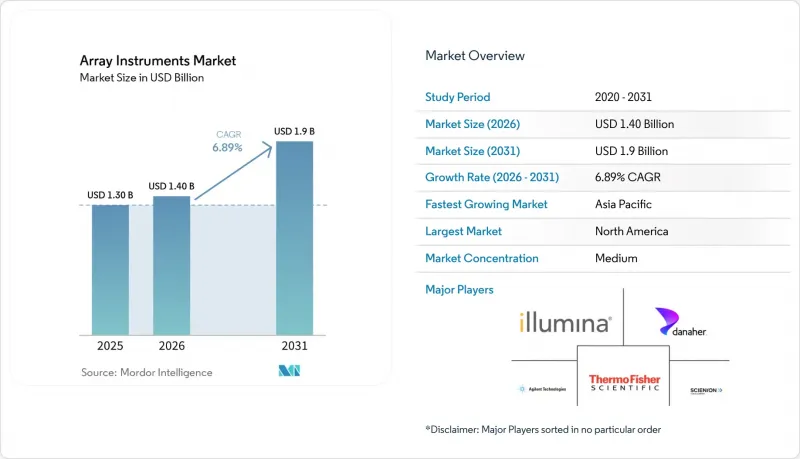
Array Instruments - Market Share Analysis, Industry Trends & Statistics, Growth Forecasts (2026 - 2031)
According to Mordor Intelligence, the array instruments market size was valued at USD 1.30 billion in 2025 and is estimated to grow from USD 1.40 billion in 2026 to reach USD 1.9 billion by 2031, at a CAGR of 6.89% during the forecast period (2026-2031).
This report is Segmented by Product Type (Scanners, Arrayers/Spotters, Hybridization/Processing Systems, and More), Application (Gene Expression, Genotyping, CMA, DNA Methylation, Protein Microarrays, and More), End User (Research Institutes, Pharma/Biotech, Clinical Labs, Cros, Government Labs), and Geography (North America, Europe, Asia-Pacific, MEA, South America). Market Forecasts are in Value (USD).
Global Array Instruments Market Trends and Insights
CMA First-Tier Adoption in Pediatrics and Cytogenetics Accelerates Scanner Installs in Clinical Labs
Chromosomal microarray testing is entrenched as the first diagnostic step for developmental delay, autism spectrum disorder, and multiple congenital anomalies after reaffirmations by pediatric and genetics societies. Diagnostic yields reach 20% in intellectual-disability cohorts, a clear improvement over conventional karyotyping. FDA-cleared assays such as CytoScan Dx allow hospitals to internalize testing, cutting external send-outs in half and saving more than USD 250,000 annually, while also shrinking denial rates from U.S. payers. Leading reference labs like Baylor Genetics report two-week result cycles for custom 400K arrays covering over 5,000 genes, keeping scanner utilization high. As reimbursement clarity widens and capital budgets unlock, clinical labs are queuing follow-on purchases for replacement or additional scanners aligned with guideline-mandated volumes. These factors sustain the array instruments market even as sequencing gains share in other domains.
Gene Expression and Genotyping Arrays Remain Core in Translational Research Workflows
Despite the flexibility of RNA-seq, microarrays retain niche advantages such as mature pipelines, lower per-sample cost, and shorter analysis time. Comparative studies in oncology show microarray-based protein-prediction models perform on par with RNA-seq for selected cancers. Illumina logged USD 297 million in array consumables for fiscal 2025, underscoring a still-large installed base of iScan and NextSeq 550 hybrids that run BeadArray assays. The 930 K-probe EPIC v2.0 methylation array pushes weekly capacity over 3,000 samples on a single scanner, making microarrays indispensable for longitudinal cohort studies where platform continuity is critical. High probe counts coupled with flat pricing lock in laboratories that value predictable budgets. Collectively, these elements insulate a sizeable revenue stream within the array of instruments market from rapid substitution.
Substitution by NGS in Discovery and Many Genotyping/CNV Applications
Sequencing's declining cost and probe-independent breadth have shifted NIH funding and academic momentum toward RNA-seq, whole-exome, and whole-genome assays. The American College of Medical Genetics clarified in 2024 that genome sequencing may supersede CMA for some neurodevelopmental indications. Illumina's array revenue fell to 8% of total in 2025, while sequencing accounted for a significant share. Yet arrays remain preferred for large-scale methylation epidemiology and certain agrigenomics workflows due to lower sample cost. The balance yields gradual, not abrupt, erosion in the array instruments market.
Other drivers and restraints analyzed in the detailed report include:
- Academic and Pharma R&D Capex Refresh Cycles Favor Automated, Higher-Throughput Microarray Instruments
- Asia-Pacific Research Expansion and Molecular Diagnostics Uptake Increase Instrument Demand
- High Upfront Instrument Cost and Total Cost of Ownership
For complete list of drivers and restraints, kindly check the Table Of Contents.
Segment Analysis
Hybridization and processing systems are expanding at a 7.31% CAGR as labs automate slide handling and washing to lift reproducibility. This segment's faster pace contrasts with the mature scanner category, which still accounted for 43.18% of 2025 revenue in the array instruments market. Price dispersion ranges from refurbished USD 16,500 GenePix units to USD 73,500 SpotLight Turbo models, aligning budgets across resource tiers.
Automation bundling is now central to procurement; modern processing lines pair sCMOS imagers with bar-coded liquid handlers, feeding data directly to LIMS for IVDR audit trails. The array instruments market for hybridization systems is poised to capitalize on this compliance-driven demand, while camera innovations achieving high quantum efficiency keep total-cost curves favorable. Emerging markets in Southeast Asia and Africa often leapfrog to such imagers, bypassing laser-based predecessors and giving vendors new-unit upside.
Geography Analysis
North America accounted for 38.19% of 2025 revenue, driven by FDA device clearances and established payer frameworks. Hospitals transitioning CMA in-house underpin recurring consumable demand. The array instruments market in the region is steady but mature, with replacement rather than greenfield installs driving unit sales.
Asia-Pacific is the locomotive, expanding at a 7.39% CAGR through 2031. India's diagnostics boom, coupled with China's NMPA approvals for medical instruments, unlocks pent-up demand for scanners and hybridizers. Funding influxes, such as Temasek's backing of Molbio and Novo Holdings' stake in MedGenome, ensure capital is available to outfit new labs with arrays and sequencers.
Europe faces IVDR-linked certification queues that are dampening near-term sales, though CE-marked platforms like QIAstat-Dx show compliance is achievable. Long-run upgrade cycles hinge on how swiftly small kit makers can revalidate under the tighter regime. Elsewhere, Latin America and Africa are adopting camera-based imagers bundled under reagent-rental deals that sidestep heavy capex, thereby expanding the future install base, albeit from a low baseline.
- Agilent Technologies
- Arrayit
- Arrayjet
- Aurora Biomed
- BioDot
- CapitalBio Technology
- Danaher
- Grace Bio-Labs
- Illumina
- InDevR
- Innopsys
- LI-COR Biosciences
- M2-Automation
- Quansys Biosciences
- SCIENION
- SciGene
- Sensovation (Miltenyi Biotec)
- Tecan Group
- Thermo Fisher Scientific
- Toray Industries (3D-Gene)
Additional Benefits:
- The market estimate (ME) sheet in Excel format
- 3 months of analyst support
TABLE OF CONTENTS
1 Introduction
- 1.1 Study Assumptions & Market Definition
- 1.2 Scope of the Study
2 Research Methodology
3 Executive Summary
4 Market Landscape
- 4.1 Market Overview
- 4.2 Market Drivers
- 4.2.1 CMA First-Tier Adoption In Pediatrics and Cytogenetics Accelerates Scanner Installs In Clinical Labs
- 4.2.2 Gene Expression and Genotyping Arrays Remain Core in Translational Research Workflows
- 4.2.3 Academic And Pharma R&D Capex Refresh Cycles Favor Automated, Higher-Throughput Microarray Instruments
- 4.2.4 APAC Research Expansion and Molecular Diagnostics Uptake Increase Instrument Demand
- 4.2.5 Multiplexed Proteomic Microarrays in Vaccine and Immunology QA/QC Expand Need for Arrayers And Compact Imagers
- 4.2.6 Camera-Based Microarray Imaging Lowers TCO Vs. Laser-Confocal Scanners, Aiding Adoption In Cost-Constrained Labs
- 4.3 Market Restraints
- 4.3.1 Substitution By NGS (RNA-Seq, WES/WGS) In Discovery and Many Genotyping/CNV Applications
- 4.3.2 High Upfront Instrument Cost and Total Cost of Ownership (Scanners, Automated Processors)
- 4.3.3 Reimbursement Variability and Payer Utilization Controls Slow Clinical Uptake Outside Select Indications
- 4.3.4 Export Controls/Sanctions Limiting Access to Lasers/Optics/Electronics Curb Installs In Russia And Select Markets
- 4.4 Supply Chain Analysis
- 4.5 Regulatory Landscape
- 4.6 Technological Outlook
- 4.7 Porter's Five Forces
- 4.7.1 Threat of New Entrants
- 4.7.2 Bargaining Power of Suppliers
- 4.7.3 Bargaining Power of Buyers
- 4.7.4 Threat of Substitutes
- 4.7.5 Competitive Rivalry
5 Market Size & Growth Forecasts (Value, USD)
- 5.1 By Product Type
- 5.1.1 Microarray Scanners
- 5.1.2 Microarray Arrayers / Spotters
- 5.1.3 Hybridization / Processing Systems (washers, ovens, processors)
- 5.1.4 Automated Workstations & Autoloaders
- 5.2 By Application
- 5.2.1 Gene Expression Profiling
- 5.2.2 Genotyping / SNP Analysis
- 5.2.3 Chromosomal Microarray Analysis (aCGH/CMA)
- 5.2.4 DNA Methylation / Epigenetics
- 5.2.5 Protein Microarray Applications (proteomics, immunoassay)
- 5.2.6 Drug Discovery & Biomarker Discovery
- 5.3 By End User
- 5.3.1 Research & Academic Institutes
- 5.3.2 Pharmaceutical & Biotechnology Companies
- 5.3.3 Clinical / Diagnostic Laboratories
- 5.3.4 CROs & Service Providers
- 5.3.5 Government & Non-profit Laboratories
- 5.4 By Geography
- 5.4.1 North America
- 5.4.1.1 United States
- 5.4.1.2 Canada
- 5.4.1.3 Mexico
- 5.4.2 Europe
- 5.4.2.1 Germany
- 5.4.2.2 United Kingdom
- 5.4.2.3 France
- 5.4.2.4 Italy
- 5.4.2.5 Spain
- 5.4.2.6 Rest of Europe
- 5.4.3 Asia-Pacific
- 5.4.3.1 China
- 5.4.3.2 India
- 5.4.3.3 Japan
- 5.4.3.4 South Korea
- 5.4.3.5 Australia
- 5.4.3.6 Rest of Asia-Pacific
- 5.4.4 Middle East and Africa
- 5.4.4.1 GCC
- 5.4.4.2 South Africa
- 5.4.4.3 Rest of Middle East and Africa
- 5.4.5 South America
- 5.4.5.1 Brazil
- 5.4.5.2 Argentina
- 5.4.5.3 Rest of South America
- 5.4.1 North America
6 Competitive Landscape
- 6.1 Market Concentration
- 6.2 Market Share Analysis
- 6.3 Company Profiles
- 6.3.1 Agilent Technologies
- 6.3.2 Arrayit Corporation
- 6.3.3 Arrayjet
- 6.3.4 Aurora Biomed
- 6.3.5 BioDot
- 6.3.6 CapitalBio Technology
- 6.3.7 Danaher Corporation
- 6.3.8 Grace Bio-Labs
- 6.3.9 Illumina, Inc.
- 6.3.10 InDevR
- 6.3.11 Innopsys
- 6.3.12 LI-COR Biosciences
- 6.3.13 M2-Automation
- 6.3.14 Quansys Biosciences
- 6.3.15 SCIENION
- 6.3.16 SciGene
- 6.3.17 Sensovation (Miltenyi Biotec)
- 6.3.18 Tecan Group
- 6.3.19 Thermo Fisher Scientific
- 6.3.20 Toray Industries (3D-Gene)
7 Market Opportunities & Future Outlook
- 7.1 White-space & Unmet-need Assessment

