
PUBLISHER: Mordor Intelligence | PRODUCT CODE: 2063571

PUBLISHER: Mordor Intelligence | PRODUCT CODE: 2063571
Targeted Therapeutics - Market Share Analysis, Industry Trends & Statistics, Growth Forecasts (2026 - 2031)
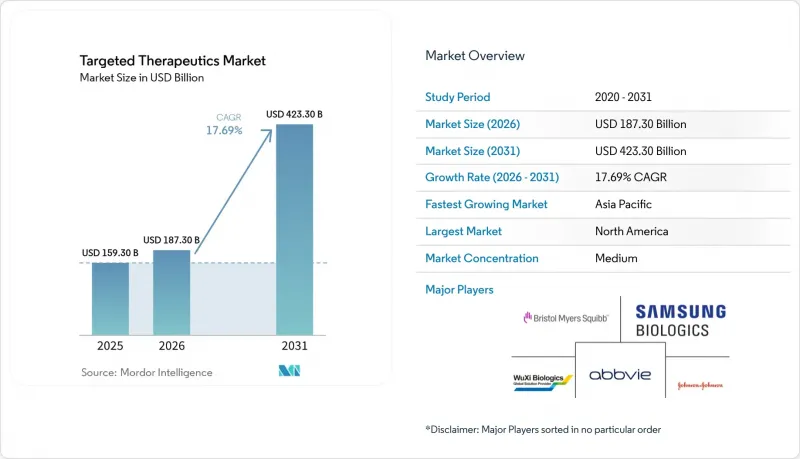
According to Mordor Intelligence, the targeted therapeutics market size is expected to increase from USD 159.30 billion in 2025 to USD 187.30 billion in 2026 and reach USD 423.30 billion by 2031, growing at a CAGR of 17.69% over 2026-2031.
This report is Segmented by Therapy Type (Monoclonal Antibodies, and More), Application (Oncology, Autoimmune & Inflammatory Diseases, and More), Route of Administration (Parenteral, and More), Distribution Channels (Hospital Pharmacies and More), and Geography (North America, Europe, Asia-Pacific, Middle East & Africa, South America). The Market Forecasts are Provided in Terms of Value (USD).
Global Targeted Therapeutics Market Trends and Insights
Expanding Oncology Adoption of Biomarker-Guided Regimens
Companion diagnostic approvals jumped 40% in 2025, enabling smaller, mutation-defined trials that lower late-stage attrition and boost per-patient revenue . Medicare's 2025 decision to reimburse next-generation sequencing (NGS) panels at up to USD 3,200 per test accelerated uptake among community oncology clinics. ACT Genomics' April 2026 launch of a 101-gene, seven-day-turnaround panel is narrowing Asia-Pacific's testing gaps and lifting the region's patient eligibility ceiling. Broader testing has, in turn, raised demand for niche inhibitors such as KRAS G12C and RET fusions, supporting premium pricing despite smaller cohorts. The feedback loop between diagnostics and therapeutics is therefore expanding the targeted therapeutics market even as precision narrows individual indications.
Monoclonal Antibody Innovation and Lifecycle Extensions
Regulators cleared subcutaneous amivantamab in 2026, cutting chair time from five hours to under ten minutes and slashing infusion-related reactions by up to 80%. Similar launches, including subcutaneous nivolumab in December 2024 and ocrelizumab in 2024, illustrate an industry-wide shift toward patient-friendly formats. Japan's Pharmaceuticals and Medical Devices Agency logged its 100th approved mAb in June 2025, confirming regulatory capacity to keep pace with complex biologics. Lifecycle extensions now bundle long-acting delivery, novel linkers, and ADC conversions, prolonging exclusivity windows as originators brace for biosimilar erosion. As a result, mAbs remain the growth anchor within the targeted therapeutics market despite looming patent cliffs.
Affordability and Payer Controls on High-Cost Specialty Drugs
Medicare's first IRA negotiation cycle set price ceilings for 10 Part D drugs in 2026, delivering USD 6 billion in federal savings but squeezing manufacturers' lifetime revenue curves. European health technology assessment bodies, led by NICE, reject therapies exceeding GBP 50,000 per quality-adjusted life year, pressuring list prices of next-in-class inhibitors. Prior authorization hurdles delay treatment initiation by up to two weeks, cutting real-world adherence and reducing peak-year sales. Emerging markets, once pricing havens, are moving toward central procurement and external reference pricing, narrowing the arbitrage window. Collectively, these trends temper the otherwise high-growth trajectory of the targeted therapeutics market.
Other drivers and restraints analyzed in the detailed report include:
- Label Expansions and Expedited Approvals Across Major Markets
- North America Scale with APAC Acceleration in Access and Manufacturing
- Biosimilar Erosion in Key Targeted Biologic Classes
For complete list of drivers and restraints, kindly check the Table Of Contents.
Segment Analysis
Monoclonal antibodies held 65.87% of 2025 therapy-type revenue, and the targeted therapeutics market size for this segment is projected to expand at a 24.19% CAGR through 2031. The 2026 approval of five-minute subcutaneous amivantamab exemplifies how delivery upgrades protect margins even as biosimilars nibble at first-generation assets. ADC conversions further extend exclusivity: Daiichi Sankyo's deruxtecan linker technology underpins multibillion-dollar deals with AstraZeneca and Merck, embedding future royalties into the segment's growth curve.
Small-molecule targeted inhibitors, once the workhorses of precision oncology, now face cross-platform competition from bispecifics and ADCs that combine tumor-specific binding with cytotoxic payloads. Elevated manufacturing lead times, 18 months for GMP bioconjugation suites, signal tight capacity but also erect barriers to entry, consolidating short-term advantage among cash-rich incumbents. Collectively, these forces secure monoclonal antibodies' role as the revenue backbone of the targeted therapeutics industry while encouraging portfolio diversification into next-generation constructs.
Oncology accounted for 68.90% of 2025 application revenue, and the targeted therapeutics market share for this segment is expected to climb further as oncology revenues grow at a 25.67% CAGR to 2031. Companion diagnostic coverage expansions under Medicare removed a major cost barrier, raising NGS uptake by community oncologists and expanding the treatable patient base.
Outside oncology, autoimmune and inflammatory diseases are catching up as IL-17 and JAK inhibitors gain reimbursement traction; the April 2025 FDA nod for Dupixent in chronic spontaneous urticaria opened a multi-billion-dollar market extension. Hematologic malignancies benefit from BCMA-targeted bispecifics like linvoseltamab, which posted a 70% overall response rate, hinting at blockbuster potential. Cardiometabolic disorders, once peripheral, are drawing attention through PCSK9 and Lp(a)-targeting siRNAs, aligning the pipeline with broad chronic-disease budgets. This diversification softens portfolio risk while preserving oncology's centrality to the targeted therapeutics market.
Geography Analysis
North America held 47.30% of 2025 revenue, buoyed by early diagnostic adoption and payer support for site-of-care shifts to physician offices following subcutaneous roll-outs. The FDA cleared 15 breakthrough oncology agents in 2025, reinforcing the region's innovation hub status. Samsung Biologics' April 2025 expansion to 784,000 liters and Bristol Myers Squibb's USD 40 billion, five-year U.S. investment signal long-term manufacturing anchorage.
Asia-Pacific is forecast to grow at 22.18% through 2031, powered by Chinese and Japanese regulatory streamlining that cut clinical start-up times by up to nine months. WuXi Biologics supports 252 ADC and 196 bispecific programs, making the region indispensable for global supply. India's Shilpa Biologics and Syngene added OEB-5 bioconjugation suites in 2025, while ACT Genomics' 101-gene panel upgrade addresses biomarker testing deficits, boosting patient eligibility.
Europe maintained a steady share in 2025 due to EMA biosimilar streamlining that shortened approval timelines by up to 18 months. Health technology assessments continue to constrain high-priced launches, yet reimbursement of subcutaneous formats that trim facility costs has broadened patient access. Infrastructure gaps persist in the Middle East & Africa and South America, where fewer than 25% of eligible patients receive NGS, keeping regional uptake muted despite high unmet need.
- Abbvie
- Amgen
- Astellas Pharma
- AstraZeneca
- Bayer
- BeiGene, Ltd.
- Bristol-Myers Squibb
- Daiichi Sankyo
- Eisai
- Eli Lilly and Company
- Exelixis, Inc.
- Roche
- Genmab
- GlaxoSmithKline
- Incyte
- Johnson & Johnson
- Merck
- Novartis
- Pfizer
- Regeneron Pharmaceuticals
- Samsung Group
- Sanofi
- Takeda Pharmaceuticals
- Wuxi Biologics
Additional Benefits:
- The market estimate (ME) sheet in Excel format
- 3 months of analyst support
TABLE OF CONTENTS
1 Introduction
- 1.1 Study Assumptions & Market Definition
- 1.2 Scope of the Study
2 Research Methodology
3 Executive Summary
4 Market Landscape
- 4.1 Market Overview
- 4.2 Market Drivers
- 4.2.1 Expanding Oncology Adoption of Biomarker-Guided Regimens
- 4.2.2 Monoclonal Antibody Innovation and Lifecycle Extensions
- 4.2.3 Label Expansions and Expedited Approvals Across Major Markets
- 4.2.4 North America Scale with APAC Acceleration in Access and Manufacturing
- 4.2.5 ADC Platform and Deal Momentum, Broadening Targeted Options
- 4.2.6 Shift To Subcutaneous/Long-Acting Formats Enabling Site-Of-Care Change
- 4.3 Market Restraints
- 4.3.1 Affordability and Payer Controls on High-Cost Specialty Drugs
- 4.3.2 Biosimilar Erosion in Key Targeted Biologic Classes
- 4.3.3 Capacity And CMC Constraints for Complex Biologics
- 4.3.4 Uneven Biomarker Testing and Access Limiting Addressable Populations
- 4.4 Supply Chain Analysis
- 4.5 Regulatory Landscape
- 4.6 Technological Outlook
- 4.7 Porter's Five Forces Analysis
- 4.7.1 Threat of New Entrants
- 4.7.2 Bargaining Power of Suppliers
- 4.7.3 Bargaining Power of Buyers
- 4.7.4 Threat of Substitutes
- 4.7.5 Competitive Rivalry
5 Market Size & Growth Forecasts (Value, USD)
- 5.1 By Therapy Type
- 5.1.1 Monoclonal Antibodies
- 5.1.2 Small-Molecule Targeted Inhibitors
- 5.1.3 Antibody-Drug Conjugates
- 5.1.4 Bispecific And Multispecific Antibodies
- 5.1.5 RNA-Targeted Therapeutics
- 5.2 By Application
- 5.2.1 Oncology
- 5.2.2 Autoimmune & Inflammatory Diseases
- 5.2.3 Hematologic Malignancies
- 5.2.4 Respiratory & Allergy
- 5.2.5 Hematology
- 5.2.6 Cardiovascular & Metabolic
- 5.2.7 Rare Genetic & Metabolic Disorders
- 5.2.8 Infectious Diseases
- 5.3 By Route of Administration
- 5.3.1 Parenteral
- 5.3.2 Oral
- 5.3.3 Others
- 5.4 By Distribution Channels
- 5.4.1 Hospital Pharmacies
- 5.4.2 Retail Pharmacies
- 5.4.3 Online Pharmacies
- 5.5 By Geography
- 5.5.1 North America
- 5.5.1.1 United States
- 5.5.1.2 Canada
- 5.5.1.3 Mexico
- 5.5.2 Europe
- 5.5.2.1 Germany
- 5.5.2.2 United Kingdom
- 5.5.2.3 France
- 5.5.2.4 Italy
- 5.5.2.5 Spain
- 5.5.2.6 Rest of Europe
- 5.5.3 Asia-Pacific
- 5.5.3.1 China
- 5.5.3.2 India
- 5.5.3.3 Japan
- 5.5.3.4 South Korea
- 5.5.3.5 Australia
- 5.5.3.6 Rest of Asia-Pacific
- 5.5.4 Middle East and Africa
- 5.5.4.1 GCC
- 5.5.4.2 South Africa
- 5.5.4.3 Rest of Middle East and Africa
- 5.5.5 South America
- 5.5.5.1 Brazil
- 5.5.5.2 Argentina
- 5.5.5.3 Rest of South America
- 5.5.1 North America
6 Competitive Landscape
- 6.1 Market Concentration
- 6.2 Market Share Analysis
- 6.3 Company Profiles (includes Global level Overview, Market Level Overview, Core Segments, Financials as Available, Strategic Information, Market Rank/Share for Key Companies, Products & Services, and Recent Developments)
- 6.3.1 AbbVie Inc.
- 6.3.2 Amgen Inc.
- 6.3.3 Astellas Pharma Inc.
- 6.3.4 AstraZeneca plc
- 6.3.5 Bayer AG
- 6.3.6 BeiGene, Ltd.
- 6.3.7 Bristol Myers Squibb Company
- 6.3.8 Daiichi Sankyo Company, Limited
- 6.3.9 Eisai Co., Ltd.
- 6.3.10 Eli Lilly and Company
- 6.3.11 Exelixis, Inc.
- 6.3.12 F. Hoffmann-La Roche Ltd
- 6.3.13 Genmab A/S
- 6.3.14 GSK plc
- 6.3.15 Incyte Corporation
- 6.3.16 Johnson & Johnson
- 6.3.17 Merck & Co., Inc.
- 6.3.18 Novartis AG
- 6.3.19 Pfizer Inc.
- 6.3.20 Regeneron Pharmaceuticals, Inc.
- 6.3.21 Samsung Biologics
- 6.3.22 Sanofi
- 6.3.23 Takeda Pharmaceutical Co. Ltd.
- 6.3.24 WuXi Biologics
7 Market Opportunities & Future Outlook
- 7.1 White-space & unmet-need assessment

