
PUBLISHER: Mordor Intelligence | PRODUCT CODE: 2063699

PUBLISHER: Mordor Intelligence | PRODUCT CODE: 2063699
Smart Managed Switch - Market Share Analysis, Industry Trends & Statistics, Growth Forecasts (2026 - 2031)
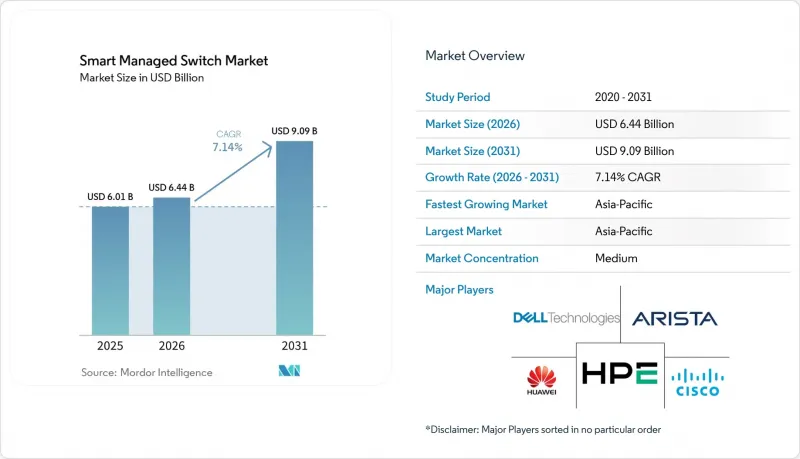
According to Mordor Intelligence, the smart managed switch market size is expected to increase from USD 6.01 billion in 2025 to USD 6.44 billion in 2026 and reach USD 9.09 billion by 2031, growing at a CAGR of 7.14% over 2026-2031.
This report is Segmented by Port Speed (Gigabit Ethernet [10/100/1000 Mbps], 10 Gigabit Ethernet, and More), Port Count (2-8 Ports, 9-24 Ports, and More), Management Method (Cloud-Native, On-Prem Native, and More), End-User Industry Size (Small and Medium Enterprises, and More), End-User Industry (IT and Telecom, Retail, and More), and Geography. The Market Forecasts are Provided in Terms of Value (USD).
Global Smart Managed Switch Market Trends and Insights
Industry 4.0 Adoption in Discrete and Process Industries
Manufacturers embracing digital twins and predictive maintenance push network designers to enforce deterministic traffic segregation without sacrificing microsecond-level synchronization. India's Production-Linked Incentive program earmarked INR 1.46 trillion (USD 19.7 billion) to electronics manufacturing, catalyzing factory investments that mandate managed switches with native PROFINET, EtherNet/IP, and OPC UA support. Rockwell Automation's Stratix series blends Cisco IOS with Device Level Ring redundancy, showing how industrial vendors meld enterprise switching with plant-floor resilience. Phoenix Contact's Ethernet-APL switch, certified to IEC TS 60079-47, extends managed Ethernet 1 km into explosive zones, eliminating legacy fieldbus gateways. As factories migrate from reactive to condition-based maintenance, unmanaged devices fail to meet the throughput and segmentation demands of high-frequency sensor telemetry.
Proliferation of PoE-Enabled Edge Devices
Wi-Fi 7 access points consume 47-51 watts per port, forcing upgrades from PoE+ to IEEE 802.3bt hardware. Wi-Fi 7 accounted for 31.1% of enterprise AP shipments in Q3 2025 and will surpass 90% by 2028. TP-Link's Omada SG3218XP-M2 provides 16 ports of 2.5 Gigabit Ethernet and a 240-watt budget, showing how mid-market buyers secure multi-gigabit uplinks without premium pricing. Beyond wireless, IP surveillance cameras and edge AI boxes consolidate power and data over Ethernet, reducing cabling yet concentrating thermal load at the switch. Labor savings from avoiding separate injectors offset the 15-20% hardware premium once deployments exceed 12 endpoints.
High Initial CapEx Versus Unmanaged Alternatives
Managed switches cost 40-60% more than unmanaged equivalents. For example, NETGEAR's GS728TXUP lists at GBP 1,552.49 (USD 1,970) versus sub-USD 800 unmanaged peers, extending payback beyond 36 months for single-site users. Component shortages and expedited sourcing premiums inflate bills further as AI accelerator demand diverts wafer capacity. Price-sensitive buyers in emerging regions often deploy unmanaged hardware plus software overlays, trading hardware-level QoS for lower capital outlays.
Other drivers and restraints analyzed in the detailed report include:
- Rapid Expansion of Cloud-Managed Networking Platforms
- AI-Driven Intent-Based Switching for SMB Networks
- Skilled Workforce Shortage for Advanced Network Management
For complete list of drivers and restraints, kindly check the Table Of Contents.
Segment Analysis
The Smart Managed Switch market size for Gigabit Ethernet led overall demand, yet 25/40 Gigabit options are accelerating at a double-digit clip. Hyperscalers gravitate to Arista's 7800R4 chassis, packing 576 ports of 800 Gigabit Ethernet in one frame. Huawei's liquid-cooled 51.2 Tbps switch halves thermal overhead, enabling eight units per cabinet. While 10 Gigabit remains prevalent in mid-tier data centers, price-parity 25 Gigabit NICs shrink oversubscription headaches. The Smart Managed Switch market share of 100 Gigabit and above platforms is rising as GPU workloads require low-latency fabrics, a trend underscored by shipments tripling in Q2 2025.
Refresh cycles compress because incremental bandwidth bumps can no longer match application growth. The Ultra Ethernet Consortium's lossless enhancements may splinter standards, but they underline demand for deterministic performance in AI clusters. Vendors differentiate through programmable ASIC telemetry pipelines that expose microburst visibility without external taps.
Fixed 9-24-port models satisfy branch offices, yet the Smart Managed Switch market size for 25-48-port devices is climbing fastest as Wi-Fi 7 mandates one switch port per access point. Extreme Networks' 4000 Series bundles Universal ZTNA at the port level, letting hospitals and banks micro-segment traffic on the switch itself.
Ruggedized 2-8-port units such as Phoenix Contact's FL SWITCH 2608 address tight industrial enclosures, commanding 50-80% price premiums. Above 48 ports, modular chassis prevail where in-service line-card upgrades justify higher cost. Instant stacking that collapses multiple units into one management domain reduces firmware touchpoints, a compelling benefit when IT teams supervise hundreds of closets.
Geography Analysis
Asia-Pacific generated over one-third of 2025 revenue and will post the fastest regional CAGR. India's smart factory initiatives, backed by INR 1.46 trillion (USD 19.7 billion) of incentives, push demand for converged OT-IT switching. Huawei's Xinghe AI Fabric 2.0 rollout in Shenzhen, Singapore, and Sydney underscores hyperscale momentum.
North America and Europe exhibit slower unit growth but trigger compliance-driven refreshes as EU Regulation 2023/826 caps standby power at 2-7 watts. The Middle East and Africa ride sovereign cloud mandates, with projects such as Saudi Arabia's HUMAIN campus specifying 400-Gigabit-ready fabrics.
South America benefits from USD 60 billion in AI data center capex, including Tecto's BRL 200 million (USD 37.2 million) Porto Alegre build. Procurement priorities diverge: Western buyers pay premiums for multi-decade support, whereas Asian customers accept emerging-vendor risk for 40-60% price savings.
- Cisco Systems Inc.
- Hewlett Packard Enterprise Company
- Juniper Networks Inc.
- Arista Networks Inc.
- Dell Technologies Inc.
- Extreme Networks Inc.
- Netgear Inc.
- TP-Link Technologies Co. Ltd.
- D-Link Corporation
- Ubiquiti Inc.
- Huawei Technologies Co. Ltd.
- ZTE Corporation
- Moxa Inc.
- Advantech Co. Ltd.
- Belden Inc.
- Phoenix Contact GmbH & Co. KG
- Siemens AG
- Rockwell Automation Inc.
- Schneider Electric SE
- ABB Ltd.
Additional Benefits:
- The market estimate (ME) sheet in Excel format
- 3 months of analyst support
TABLE OF CONTENTS
1 INTRODUCTION
- 1.1 Study Assumptions and Market Definition
- 1.2 Scope of the Study
2 RESEARCH METHODOLOGY
3 EXECUTIVE SUMMARY
4 MARKET LANDSCAPE
- 4.1 Market Overview
- 4.2 Market Drivers
- 4.2.1 Industry 4.0 Adoption in Discrete and Process Industries
- 4.2.2 Proliferation of PoE-Enabled Edge Devices
- 4.2.3 Rapid Expansion of Cloud-Managed Networking Platforms
- 4.2.4 AI-Driven Intent-Based Switching for SMB Networks
- 4.2.5 Wi-Fi 7 Multi-Gigabit Access Layer Upgrades
- 4.2.6 Energy-Efficiency Mandates and Incentives for ICT Equipment
- 4.3 Market Restraints
- 4.3.1 High Initial Capex Versus Unmanaged Alternatives
- 4.3.2 Skilled Workforce Shortage for Advanced Network Management
- 4.3.3 Semiconductor Supply-Chain Volatility
- 4.3.4 Vendor Lock-in from Proprietary Cloud Portals
- 4.4 Supply-Chain Analysis
- 4.5 Regulatory Landscape
- 4.6 Technological Outlook
- 4.7 Impact of Macroeconomic Factors on the Market
- 4.8 Porter's Five Forces Analysis
- 4.8.1 Threat of New Entrants
- 4.8.2 Bargaining Power of Suppliers
- 4.8.3 Bargaining Power of Buyers
- 4.8.4 Threat of Substitutes
- 4.8.5 Industry Rivalry
5 MARKET SIZE AND GROWTH FORECASTS (VALUE)
- 5.1 By Port Speed
- 5.1.1 Gigabit Ethernet (10/100/1000 Mbps)
- 5.1.2 10 Gigabit Ethernet
- 5.1.3 25/40 Gigabit Ethernet
- 5.1.4 100 Gigabit and Above
- 5.2 By Port Count
- 5.2.1 2-8 Ports
- 5.2.2 9-24 Ports
- 5.2.3 25-48 Ports
- 5.2.4 Above 48 Ports
- 5.3 By Management Method
- 5.3.1 Cloud-native
- 5.3.2 On-prem native
- 5.3.3 Hybrid
- 5.4 By End-User Industry Size
- 5.4.1 Small and Medium Enterprises
- 5.4.2 Large Enterprises
- 5.5 By End-User Industry
- 5.5.1 IT and Telecom
- 5.5.2 Healthcare
- 5.5.3 Retail
- 5.5.4 Government
- 5.5.5 Education
- 5.5.6 Other End-User industries
- 5.6 By Geography
- 5.6.1 North America
- 5.6.1.1 United States
- 5.6.1.2 Canada
- 5.6.1.3 Mexico
- 5.6.2 South America
- 5.6.2.1 Brazil
- 5.6.2.2 Argentina
- 5.6.2.3 Rest of South America
- 5.6.3 Europe
- 5.6.3.1 Germany
- 5.6.3.2 United Kingdom
- 5.6.3.3 France
- 5.6.3.4 Italy
- 5.6.3.5 Spain
- 5.6.3.6 Russia
- 5.6.3.7 Rest of Europe
- 5.6.4 Asia-Pacific
- 5.6.4.1 China
- 5.6.4.2 Japan
- 5.6.4.3 India
- 5.6.4.4 South Korea
- 5.6.4.5 Australia and New Zealand
- 5.6.4.6 Rest of Asia-Pacific
- 5.6.5 Middle East
- 5.6.5.1 Saudi Arabia
- 5.6.5.2 United Arab Emirates
- 5.6.5.3 Turkey
- 5.6.5.4 Rest of Middle East
- 5.6.6 Africa
- 5.6.6.1 South Africa
- 5.6.6.2 Egypt
- 5.6.6.3 Nigeria
- 5.6.6.4 Rest of Africa
- 5.6.1 North America
6 COMPETITIVE LANDSCAPE
- 6.1 Market Concentration
- 6.2 Strategic Moves
- 6.3 Market Share Analysis
- 6.4 Company Profiles (includes Global Level Overview, Market Level Overview, Core Segments, Financials as available, Strategic Information, Market Rank/Share, Products and Services, Recent Developments)
- 6.4.1 Cisco Systems Inc.
- 6.4.2 Hewlett Packard Enterprise Company
- 6.4.3 Juniper Networks Inc.
- 6.4.4 Arista Networks Inc.
- 6.4.5 Dell Technologies Inc.
- 6.4.6 Extreme Networks Inc.
- 6.4.7 Netgear Inc.
- 6.4.8 TP-Link Technologies Co. Ltd.
- 6.4.9 D-Link Corporation
- 6.4.10 Ubiquiti Inc.
- 6.4.11 Huawei Technologies Co. Ltd.
- 6.4.12 ZTE Corporation
- 6.4.13 Moxa Inc.
- 6.4.14 Advantech Co. Ltd.
- 6.4.15 Belden Inc.
- 6.4.16 Phoenix Contact GmbH & Co. KG
- 6.4.17 Siemens AG
- 6.4.18 Rockwell Automation Inc.
- 6.4.19 Schneider Electric SE
- 6.4.20 ABB Ltd.
7 MARKET OPPORTUNITIES AND FUTURE OUTLOOK
- 7.1 White-Space and Unmet-Need Assessment

