
PUBLISHER: Mordor Intelligence | PRODUCT CODE: 2063881

PUBLISHER: Mordor Intelligence | PRODUCT CODE: 2063881
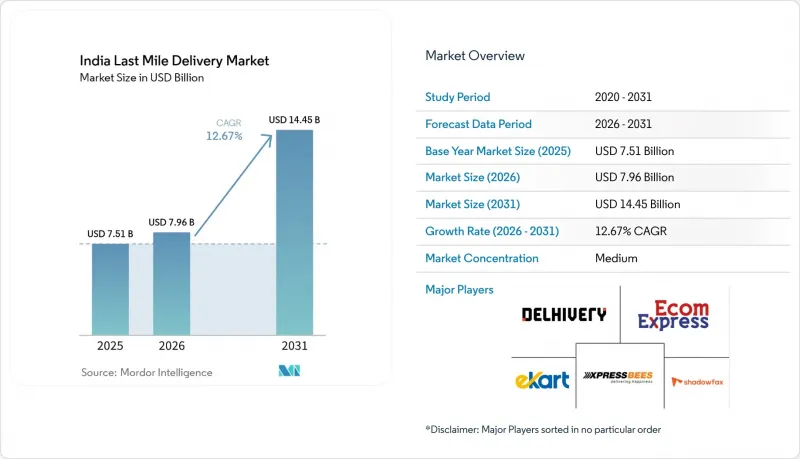
India Last Mile Delivery - Market Share Analysis, Industry Trends & Statistics, Growth Forecasts (2026 - 2031)
According to Mordor Intelligence, the india last mile delivery market size is projected to expand from USD 7.51 billion in 2025 and USD 7.96 billion in 2026 to USD 14.45 billion by 2031, registering a CAGR of 12.67% between 2026 to 2031.
This report is Segmented by Service (Same-Day Delivery, Express Delivery, Standard Delivery), by Business Model (B2B, B2C, C2C), by End User Industry (E-Commerce Retail, Fashion and Lifestyle, Beauty, Wellness and Personal Care, Home and Furniture, Consumer Electronics and Appliances, and More), and by Region (North, Central, West, East, South). Market Forecasts are Provided in Terms of Value (USD).
India Last Mile Delivery Market Trends and Insights
Explosive E-Commerce GMV Surge in Tier-2/3 Cities
Tier-2 and Tier-3 GMV expanded by 42% in 2025, far outstripping metro growth, as smartphone penetration crossed 61% in rural areas and vernacular apps lowered entry barriers for first-time buyers. Flipkart's Ekart expanded its pin-code coverage from 19,000 to 23,500, compressing the two-day delivery coverage across Jaipur, Lucknow, and Visakhapatnam. At the same time, ElasticRun's kirana network model has reduced last-mile costs by 30% in Uttar Pradesh and Bihar. Parcel density now justifies direct truck routes, reducing reliance on hubs and spokes, though 40% of addresses still lack standardized building numbers, adding 8-12 minutes per stop. The Indian last-mile delivery market is therefore pivoting to adopt intelligent engines to improve first-attempt success rates. Carriers that crack rural geocoding will secure loyalty in the fastest-growing demand pockets.
Rapid Expansion of Quick-Commerce and Dark Stores
Dark-store count hit 1,489 by March 2026, up 67% in fifteen months as Blinkit, Zepto, and Swiggy Instamart raced to maintain 10-15-minute delivery promises. Funding inflows Zepto's USD 1 billion in 2025 and Blinkit's integration within Zomato underscore investor confidence that high order frequency offsets smaller baskets. Real estate premiums of 35% in Andheri and Koramangala highlight the strategic value of hyperlocal nodes. Category expansion into electronics lifted average order values to INR 485 (USD 5.13), pushing contribution margins positive in select micro-markets. Draft FSSAI norms on temperature logs for perishables are likely to create compliance hurdles, favoring platforms with cold-chain readiness.
Metro Quick-Commerce Saturation and Discount Wars
Penetration among online grocery shoppers crossed 38% in Mumbai, Delhi-NCR, and Bengaluru by March 2026, near maturity levels seen in South Korea, driving customer-acquisition costs up 62% year on year. The collective cash burn of INR 3,200 (USD 33.86) crore in FY 2025-26 slashed gross margins to 11%, down from 18% a year earlier. Average order values fell to INR 440 (USD 4.66) as consumers cherry-picked discount SKUs, undermining category-expansion strategies. The Competition Commission has opened a probe into alleged predatory pricing, stoking uncertainty. Platforms are pivoting toward Tier-1 cities where density is lower and delivery promises can stretch to 20-30 minutes, but the economics remain unproven.
Other drivers and restraints analyzed in the detailed report include:
- National Logistics Policy and Corridor Build-Out
- AI-Driven Routing and Fulfillment Optimization
- High RTO Rates from Tier-2/3 Address Quality Gaps
For complete list of drivers and restraints, kindly check the Table Of Contents.
Segment Analysis
Standard delivery led with 58.19% of the Indian last-mile delivery market share in 2025, while same-day delivery is projected to post the highest 14.32% CAGR through 2031. Standard delivery's 2025 lead rests on its suitability for non-perishable categories that tolerate 3-5-day windows. Express delivery bridges the gap for fashion orders where next-day delivery matters but premium fees deter same-day uptake. Carriers are channeling capex into AI sortation lines, such as Delhivery's Bengaluru gateway, which handles 1.2 million parcels daily. These shifts will gradually shift the India last-mile delivery market toward faster tiers without erasing the cost-efficient standard segment.
Network differentiation now hinges on dark-store density and data-driven slot-allocation. Amazon's Prime Now processed 42 million shipments in 2025, sustaining a 35% price premium that Indian consumers are willing to pay to avoid stockouts. Blue Dart's Tier-2 express surge during the 2025 festive season underscores the hinterland's appetite for a predictable next-day service. As AI-enabled dynamic routing proliferates, carriers that balance cost and speed will capture incremental market share in India's last-mile delivery market.
List of Companies Covered in this Report:
- Delhivery
- Ecom Express
- Xpressbees
- Shadowfax
- Ekart Logistics
- Loadshare Networks
- ElasticRun
- Dunzo
- Borzo
- Porter
- Blue Dart Express
- DTDC Express
- Allcargo Gati
- Safexpress
- Mahindra Logistics
- TCI Express
- FedEx India
- DHL eCommerce
- Aramex India
- Amazon Transportation Services
- Reliance Retail Logistics
- India Post
Additional Benefits:
- The market estimate (ME) sheet in Excel format
- 3 months of analyst support
TABLE OF CONTENTS
1 Introduction
- 1.1 Study Assumptions & Market Definition
- 1.2 Scope of the Study
2 Research Methodology
3 Executive Summary
4 Market Landscape
- 4.1 Market Overview
- 4.2 Market Drivers
- 4.2.1 Explosive E-Commerce GMV Surge in Tier-2/3 Cities
- 4.2.2 Rapid Expansion of Quick-Commerce and Dark Stores
- 4.2.3 National Logistics Policy and Corridor Build-Out
- 4.2.4 AI-Driven Routing and Fulfilment Optimization
- 4.2.5 Electric 2-Wheeler-as-a-Service Unlocking Gig Capacity
- 4.2.6 ULIP Open-API Data Platform Streamlining Compliance
- 4.3 Market Restraints
- 4.3.1 Metro Quick-Commerce Saturation and Discount Wars
- 4.3.2 High RTO Rates from Tier-2/3 Address Quality Gaps
- 4.3.3 Urban Congestion & Parking Shortages Inflating Costs
- 4.3.4 Sparse EV-Charging/Financing Slowing Green Fleets
- 4.4 Regulatory Framework
- 4.5 Value Chain and Distribution Channel Analysis
- 4.6 Technology Innovations Outlook
- 4.7 Porter's Five Forces
- 4.7.1 Threat of New Entrants
- 4.7.2 Bargaining Power of Suppliers
- 4.7.3 Bargaining Power of Buyers
- 4.7.4 Threat of Substitutes
- 4.7.5 Rivalry Among Competitors
- 4.8 Insights on Warehousing & Distribution Centers
- 4.9 Insights on Refrigerated Last-Mile Delivery
- 4.10 Reverse / Return Logistics Insights
- 4.11 Impact of Geo-Political Events on Supply Chain Shifts
5 Market Size & Growth Forecasts (Value, 2026-2031)
- 5.1 By Service
- 5.1.1 Same-day Delivery
- 5.1.2 Express Delivery
- 5.1.3 Standard Delivery
- 5.2 By Business Model
- 5.2.1 Business-to-Business (B2B)
- 5.2.2 Business-to-Consumer (B2C)
- 5.2.3 Customer-to-Consumer (C2C)
- 5.3 By End User Industry
- 5.3.1 E-commerce Retail
- 5.3.2 Fashion and Lifestyle
- 5.3.3 Beauty, Wellness and Personal Care
- 5.3.4 Home and Furniture
- 5.3.5 Consumer Electronics and Appliances
- 5.3.6 Healthcare and Medical Supplies
- 5.3.7 Others
- 5.4 By Region
- 5.4.1 North
- 5.4.2 Central
- 5.4.3 West
- 5.4.4 East
- 5.4.5 South
6 Competitive Landscape
- 6.1 Market Concentration
- 6.2 Key Strategic Moves
- 6.3 Market Share Analysis
- 6.4 Company Profiles (includes Global level Overview, Market level overview, Core Segments, Financials as available, Strategic Information, Market Rank/Share for key companies, Products & Services, and Recent Developments)
- 6.4.1 Delhivery
- 6.4.2 Ecom Express
- 6.4.3 Xpressbees
- 6.4.4 Shadowfax
- 6.4.5 Ekart Logistics
- 6.4.6 Loadshare Networks
- 6.4.7 ElasticRun
- 6.4.8 Dunzo
- 6.4.9 Borzo
- 6.4.10 Porter
- 6.4.11 Blue Dart Express
- 6.4.12 DTDC Express
- 6.4.13 Allcargo Gati
- 6.4.14 Safexpress
- 6.4.15 Mahindra Logistics
- 6.4.16 TCI Express
- 6.4.17 FedEx India
- 6.4.18 DHL eCommerce
- 6.4.19 Aramex India
- 6.4.20 Amazon Transportation Services
- 6.4.21 Reliance Retail Logistics
- 6.4.22 India Post
7 Market Opportunities & Future Outlook
- 7.1 White-space & Unmet-Need Assessment

