
PUBLISHER: Mordor Intelligence | PRODUCT CODE: 2063943

PUBLISHER: Mordor Intelligence | PRODUCT CODE: 2063943
GPU In Healthcare And Medical Imaging - Market Share Analysis, Industry Trends & Statistics, Growth Forecasts (2026 - 2031)
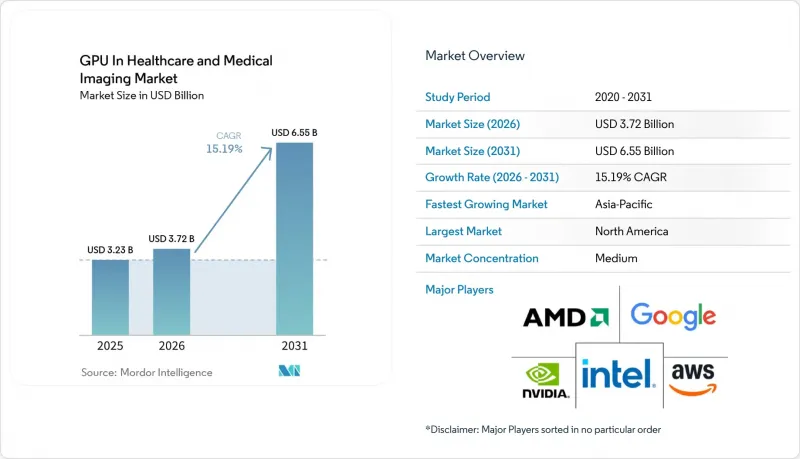
According to Mordor Intelligence, the gPU in healthcare and medical imaging market size is expected to increase from USD 3.23 billion in 2025 to USD 3.72 billion in 2026 and reach USD 6.55 billion by 2031, growing at a CAGR of 15.19% over 2026-2031.
This report is Segmented by Application (Medical Imaging and Reconstruction, AI-Based Diagnostics, Genomics and Bioinformatics, and More), Deployment Model (On-Premises, and More), GPU Usage (Training Workloads, Inference/Clinical Deployment, and More), End-User Type (Hospitals and Diagnostic Centers, and More), and Geography. The Market Forecasts are Provided in Terms of Value (USD).
Global GPU In Healthcare And Medical Imaging Market Trends and Insights
Accelerating Adoption of Foundation-Model Medical Imaging LLMs
Foundation models trained on more than 10 million radiology scans deliver zero-shot performance across CT, MRI and ultrasound. A 2025 Nature Communications study reported radiologist-level sensitivity on 14 chest-pathology classes, but real-time deployment required GPU (Graphics Processing Unit) clusters with at least 640 GB aggregate memory. Hospitals therefore shift budgets toward H100-class accelerators that support mixed-precision inference and micro-second interconnects. The FDA clearance of triage algorithm K243866 validated clinical utility, shortening procurement cycles. However, interpretability challenges and rising liquid-cooling costs constrain adoption among mid-tier facilities.
Surge in Multi-Modal AI Diagnostics Integrating Radiology and Pathology
Oncology programs increasingly fuse MRI volumes with whole-slide pathology images to correlate macro-anatomical and micro-biomarker patterns. A 2024 European deployment reduced biopsy rates by 18% but required a 16-GPU cluster to process 40-gigapixel slides alongside 3D scans. Compliance with the EU AI Act's transparency mandate favors vendors with ISO 13485 processes. Smaller startups struggle to secure annotated data and meet sub-5-second latency expectations in tumor boards.
Persistent Bottlenecks in Healthcare Data Labeling Quality
Radiology departments face a 15,000-radiologist shortfall in the United States, and outsourced labeling shows inter-annotator agreement below regulatory thresholds. Multi-stage review workflows extend project timelines by up to nine months, while active-learning solutions still demand GPU resources, creating a circular dependency for resource-constrained clinics.
Other drivers and restraints analyzed in the detailed report include:
- Genomic Sequencing Price Drop Below USD 100 Spurring GPU Cloud Demand
- Regulatory Fast-Tracking of SaMD Algorithms in United States and Europe
- High TCO of On-Premise H100-Class GPU Clusters for Mid-Tier Hospitals
For complete list of drivers and restraints, kindly check the Table Of Contents.
Segment Analysis
Medical imaging and reconstruction generated 38.22% of 2025 revenue within the GPU in healthcare and medical imaging market size, reaffirming CT reconstruction, MRI denoising and 3D surgical visualization as Graphics Processing Unit-intensive mainstays. AI-based diagnostics broaden the mix as cleared algorithms address diabetic retinopathy, stroke triage and pulmonary embolism. Growing genomics pipelines leverage GPUs for real-time variant calling as sequencing volumes soar. Drug discovery and simulation, though a smaller slice, posts the fastest growth, buoyed by generative models that screen billions of compounds in weeks rather than months.
Early adopters combine 512-GPU clusters with diffusion models to identify lead molecules, compressing traditional 18-month screening windows to just six weeks. Healthcare robotics and surgery remains nascent but demonstrates promise through pilot deployments that use GPU-accelerated vision to guide instruments and classify tissue in vivo. Continued regulatory clarity around autonomy and liability is expected to unlock further uptake after 2028.
On-premise systems delivered 51.45% of 2025 revenue, anchored by legacy PACS integration and stringent latency targets. Nevertheless, cloud-based healthcare AI platforms record the steepest CAGR, as subscription models eliminate capital intensity and provide instant access to foundation models. A 2025 hospital survey indicated 38% had already migrated at least one workload to public cloud resources.
Hybrid strategies dominate among academic medical centers that retain sensitive data locally while bursting to cloud for training. Cloud vendors have countered sovereignty concerns with dedicated healthcare regions and contract-level audit logging, narrowing the trust gap. The Graphics Processing Unit in healthcare and imaging market continues to rebalance as rural hospitals favor managed services, whereas urban tertiary centers maintain edge clusters for time-critical tasks.
Geography Analysis
North America led the GPU in healthcare market with 40.67% revenue share in 2025, propelled by dense academic-medical ecosystems, venture funding and a streamlined FDA 510(k) process that cleared 18 SaMD algorithms since 2024. U.S. metropolitan centers deploy liquid-cooled H100 clusters for radiology and pathology applications, while Canada invests in cloud-based telemedicine to reach remote communities. Mexico's private hospital chains adopt AI diagnostics to differentiate offerings, though scale remains modest.
Asia-Pacific is the fastest-growing region through 2031. China's Healthy China 2030 earmarked CNY 50 billion (USD 7 billion) for IT modernization, prioritizing GPU-backed imaging and telehealth. India's National Digital Health Mission integrates AI triage across a 1.4 billion-person population, demanding regional cloud zones with latency under 150 milliseconds. Japan and South Korea focus on robotics-assisted surgery and precision oncology, leveraging mature reimbursement frameworks. Regulatory heterogeneity persists, yet regional bodies such as the NMPA and CDSCO move toward risk-based SaMD approvals.
Europe holds a moderate share, characterized by stringent MDR and AI Act compliance that lengthens technical-file preparation but improves market trust. Germany, the United Kingdom and France lead adoption via national radiology networks. South America and the Middle East and Africa remain smaller, but pilot programs in Brazil and the United Arab Emirates illustrate growing interest, especially in tuberculosis screening and diabetic retinopathy detection.
- NVIDIA Corporation
- Advanced Micro Devices, Inc.
- Intel Corporation
- Amazon Web Services, Inc.
- Google LLC
- Microsoft Corporation
- Graphcore Ltd
- Cerebras Systems Inc.
- Koninklijke Philips N.V.
- GE HealthCare Technologies Inc.
- Siemens Healthineers AG
- Canon Medical Systems Corporation
- Tencent Cloud Computing (Beijing) Co., Ltd.
- Alibaba Cloud Computing Co., Ltd.
- Butterfly Network, Inc.
- Paige AI, Inc.
- Tempus Labs, Inc.
- Graphcore Ltd.
- Dell Technologies Inc.
- Hewlett Packard Enterprise Company
Additional Benefits:
- The market estimate (ME) sheet in Excel format
- 3 months of analyst support
TABLE OF CONTENTS
1 INTRODUCTION
- 1.1 Study Assumptions and Market Definition
- 1.2 Scope of the Study
2 RESEARCH METHODOLOGY
3 EXECUTIVE SUMMARY
4 MARKET LANDSCAPE
- 4.1 Market Overview
- 4.2 Market Drivers
- 4.2.1 Accelerating Adoption of Foundation-Model Medical Imaging LLMs
- 4.2.2 Surge in Multi-Modal AI Diagnostics Integrating Radiology and Pathology
- 4.2.3 Genomic Sequencing Price Drop Below USD 100 Spurring GPU Cloud Demand
- 4.2.4 Regulatory Fast-Tracking of SaMD Algorithms in United States and Europe
- 4.2.5 Hospital-Edge Data Centers for Real-Time Surgical Visualization
- 4.2.6 Venture Capital Inflow Into Generative Drug-Discovery Startups
- 4.3 Market Restraints
- 4.3.1 Persistent Bottlenecks in Healthcare Data Labeling Quality
- 4.3.2 High TCO of On-Premise H100-Class GPU Clusters for Mid-Tier Hospitals
- 4.3.3 Inter-Operability Gaps Between PACS/RIS and AI Inference Pipelines
- 4.3.4 Rising Scrutiny on Carbon Footprint of Large-Scale Model Training
- 4.4 Industry Value Chain Analysis
- 4.5 Regulatory Landscape
- 4.6 Technological Outlook
- 4.7 Porter's Five Forces Analysis
- 4.7.1 Threat of New Entrants
- 4.7.2 Bargaining Power of Buyers
- 4.7.3 Bargaining Power of Suppliers
- 4.7.4 Threat of Substitutes
- 4.7.5 Competitive Rivalry
- 4.7.6 Impact of Macroeconomic Factors
5 MARKET SIZE AND GROWTH FORECASTS (VALUE)
- 5.1 By Application
- 5.1.1 Medical Imaging and Reconstruction
- 5.1.2 AI-Based Diagnostics
- 5.1.3 Genomics and Bioinformatics
- 5.1.4 Drug Discovery and Simulation
- 5.1.5 Healthcare Robotics and Surgery
- 5.2 By Deployment Model
- 5.2.1 On-Premise (Hospitals / Labs)
- 5.2.2 Cloud-Based Healthcare AI Platforms
- 5.2.3 Hybrid
- 5.3 By GPU Usage Type
- 5.3.1 Training Workloads
- 5.3.2 Inference / Clinical Deployment
- 5.3.3 Visualization / Rendering
- 5.4 By End-User Type
- 5.4.1 Hospitals and Diagnostic Centers
- 5.4.2 Pharmaceutical and Biotech Companies
- 5.4.3 Research Institutions
- 5.4.4 Telemedicine / Digital Health Providers
- 5.5 By Geography
- 5.5.1 North America
- 5.5.1.1 United States
- 5.5.1.2 Canada
- 5.5.1.3 Mexico
- 5.5.2 Europe
- 5.5.2.1 Germany
- 5.5.2.2 United Kingdom
- 5.5.2.3 France
- 5.5.2.4 Rest of Europe
- 5.5.3 Asia-Pacific
- 5.5.3.1 China
- 5.5.3.2 Japan
- 5.5.3.3 South Korea
- 5.5.3.4 India
- 5.5.3.5 Rest of Asia-Pacific
- 5.5.4 South America
- 5.5.5 Middle East and Africa
- 5.5.1 North America
6 COMPETITIVE LANDSCAPE
- 6.1 Market Concentration
- 6.2 Strategic Moves
- 6.3 Market Share Analysis
- 6.4 Company Profiles (includes Global Level Overview, Market Level Overview, Core Segments, Financials as available, Strategic Information, Market Rank/Share, Products and Services, Recent Developments)
- 6.4.1 NVIDIA Corporation
- 6.4.2 Advanced Micro Devices, Inc.
- 6.4.3 Intel Corporation
- 6.4.4 Amazon Web Services, Inc.
- 6.4.5 Google LLC
- 6.4.6 Microsoft Corporation
- 6.4.7 Graphcore Ltd
- 6.4.8 Cerebras Systems Inc.
- 6.4.9 Koninklijke Philips N.V.
- 6.4.10 GE HealthCare Technologies Inc.
- 6.4.11 Siemens Healthineers AG
- 6.4.12 Canon Medical Systems Corporation
- 6.4.13 Tencent Cloud Computing (Beijing) Co., Ltd.
- 6.4.14 Alibaba Cloud Computing Co., Ltd.
- 6.4.15 Butterfly Network, Inc.
- 6.4.16 Paige AI, Inc.
- 6.4.17 Tempus Labs, Inc.
- 6.4.18 Graphcore Ltd.
- 6.4.19 Dell Technologies Inc.
- 6.4.20 Hewlett Packard Enterprise Company
7 MARKET OPPORTUNITIES AND FUTURE OUTLOOK
- 7.1 White-Space and Unmet-Need Assessment

