
PUBLISHER: Mordor Intelligence | PRODUCT CODE: 2064381

PUBLISHER: Mordor Intelligence | PRODUCT CODE: 2064381
Patch Management - Market Share Analysis, Industry Trends & Statistics, Growth Forecasts (2026 - 2031)
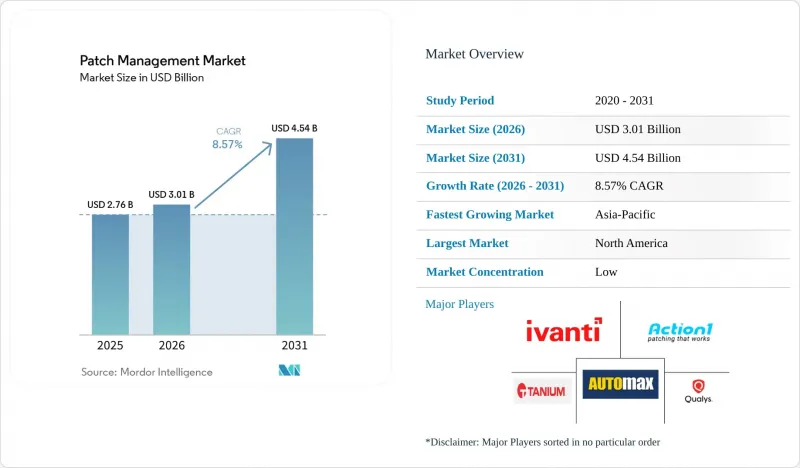
According to Mordor Intelligence, the patch management market size is projected to expand from USD 2.76 billion in 2025 and USD 3.01 billion in 2026 to USD 4.54 billion by 2031, registering a CAGR of 8.57% between 2026 and 2031.
This report is Segmented by Component (Software, and Services), Deployment Mode (Cloud-Based, and On-Premises), Organization Size (Large Enterprises, and Small and Medium Enterprises), Industry Vertical (BFSI, IT and Telecom, Healthcare and Life Sciences, Government and Defense, Retail and E-Commerce, Energy and Utilities, and More), and Geography. The Market Forecasts are Provided in Terms of Value (USD).
Global Patch Management Market Trends and Insights
Escalating Exploitation of Known Vulnerabilities
The strongest near-term force behind patch management market demand is the continued rise in actively exploited vulnerabilities. CISA's Known Exploited Vulnerabilities catalog had reached 1,592 entries by May 2026, providing security teams with a clear signal that a large and growing set of flaws is already tied to real-world attacks. That environment changes how patching budgets are prioritized, because organizations cannot rely on broad severity queues when a narrower set of known-exploited issues requires immediate action. It also pushes the patch management market toward tools that can ingest KEV intelligence quickly and map it directly to affected assets and patch workflows. Vendors that can cut the time between external threat intelligence and internal remediation execution are therefore gaining a clearer value proposition in enterprise buying cycles.
Tightening Cyber Resilience and Compliance Mandates
Compliance is now a direct spending driver for the patch management market, especially where vulnerability handling is tied to legal accountability and formal supervisory review. The European Commission states that NIS2 requires covered entities to address vulnerability management, and penalties can reach EUR 10 million (USD 10.8 million) or 2% of global annual turnover for non-compliance. This is raising demand for platforms that can document prioritization logic, remediation timing, approvals, and rollback procedures in a form that internal audit and regulators can review. ENISA reported that 70% of EU organizations named regulatory compliance as their main cybersecurity investment driver in 2024, and 50% identified patch management as the most difficult NIS2 requirement to address. As these rules mature, the patch management market is likely to favor vendors that combine automation with deep reporting rather than those that focus solely on deployment mechanics.
Patch Compatibility and Business Downtime Risk
Patch-related service disruptions remain a significant brake on the patch management market, as many organizations still weigh outage risk against exploit risk when scheduling deployment windows. This issue is most pronounced in environments where downtime has direct operational or safety consequences, including healthcare, manufacturing, and financial infrastructure. In these settings, automated rollout is often limited by the need for validation, testing, and rollback planning before production deployment can proceed. The result is that even when patch intelligence improves, execution speed can still slow down if teams lack confidence that updates will not interrupt core workflows. This restraint keeps demand high for platforms that can improve pre-deployment testing, staged rollout design, and change control visibility.
Other drivers and restraints analyzed in the detailed report include:
- Growth in Hybrid Work and Distributed Endpoints
- Shift Toward Cloud-Native and Automated Patching
- Legacy Systems and Fragmented Endpoint Estates
For complete list of drivers and restraints, kindly check the Table Of Contents.
Segment Analysis
Software accounted for 62.13% of the patch management market in 2025, making it the largest component. Revenue still centers on operating system patching, third-party application updates, and cross-platform automation layers that help enterprises manage large and mixed device fleets. Product investment in 2025 and 2026 has been moving toward broader platform coverage, because buyers accounted for 62.13% of the patch management market in 2025, making it the largest components want fewer tools and a more unified remediation workflow. Action1 expanded to Linux in November 2025 across Ubuntu, Debian, Red Hat Enterprise Linux, and SUSE, which reflects the wider shift toward heterogeneous fleet coverage rather than single-OS patch execution.
Compliance needs are also strengthening the software case in the patch management industry, as organizations need records showing whether managed applications are patched on time and tracked across the estate. Adaptiva said in December 2025 that its platform catalog covered more than 250,000 patches across more than 20,000 products, which supports the demand for deeper third-party application coverage and stronger audit readiness. Services is the fastest-growing component, and the patch management market size for this segment is projected to grow at 8.97% CAGR through 2031. Managed services are capturing most of that incremental demand, as enterprises and SMEs increasingly want external teams to handle policy execution, exception handling, and reporting. ENISA's finding that 76% of EU organizations struggled to attract cybersecurity staff supports the structural shift toward service-led delivery.
Cloud-based deployment captured 55.89% of the patch management market in 2025 and is also the fastest-growing deployment mode, with an 8.92% CAGR through 2031. That lead reflects a clear advantage in remote and hybrid environments, where cloud-based agents can enforce patch policy without depending on on-premises relay infrastructure or VPN connectivity. The model also supports faster central policy updates and broader reach across distributed devices, both of which are core needs in the patch management market. Adaptiva reported 70% growth in new customer acquisition in 2025 and a 75% increase in co-sell wins, indicating sustained customer interest in cloud-native patch and endpoint architectures.
On-premises deployment still matters in air-gapped environments, classified networks, and industrial settings where data residency or network isolation limits cloud use. Ivanti introduced ISA6500 and ISA8500 sovereign appliances in April 2026, which shows that vendors still see demand for local form factors tied to cloud-managed policy orchestration and regional data controls. This means the on-premises segment is narrowing rather than disappearing, and the patch management market is serving a smaller but durable specialist tier of customers that cannot fully move to shared cloud delivery. The broader direction remains clear, as cloud platforms better fit distributed endpoints, leaner IT teams, and the push for faster remediation cycles.
Geography Analysis
North America accounted for 41.84% of the patch management market in 2025, making it the largest regional contributor. The United States accounts for most regional demand because large enterprise budgets, a mature managed services ecosystem, and strict internal governance all support higher patching spend. CISA's continued expansion of the KEV catalog and its active vulnerability coordination role give organizations in the region a practical intelligence feed that sharpens prioritization and speeds execution. Canada and Mexico add demand through cross-border enterprise networks and growing MSP coverage in mid-market accounts. The region also benefits from a dense vendor base, which keeps the patch management market highly competitive and pushes product capabilities upward.
Asia-Pacific is the fastest-growing region, with the patch management market advancing at a 9.57% CAGR through 2031. Larger endpoint estates, stronger cybersecurity frameworks, and a continuing move toward cloud-delivered operations across enterprise IT are supporting growth. Trend Micro reported in March 2025 that Japan had a mean time to patch of 36.4 days, which was 1.2 times slower than the global average, indicating a clear automation gap in a major regional market. Action1 committed to India data residency effective April 1, 2026, which shows that vendors now see local compliance alignment as part of their expansion strategy in the region. Australia and other Asia-Pacific markets are also giving patch governance a firmer place inside national cyber programs, which supports longer-term adoption.
Europe held the second-largest share in 2025, with the United Kingdom, Germany, and France leading demand across enterprise and mid-market users. ENISA reported that 70% of EU organizations identified regulatory compliance as their primary cybersecurity investment driver in 2024, and organizations newly entering the NIS2 scope saw an average 22% increase in cybersecurity budgets. This keeps the patch management market closely tied to formal compliance programs, documented control design, and procurement cycles shaped by regulatory review. South America, the Middle East, and Africa remain early-stage regions, where Brazil and the UAE lead demand as cloud adoption rises and MSP penetration improves across smaller organizations.
- Action1 Corporation
- Addigy, Inc.
- Acronis International GmbH
- Adaptive Protocols, Inc.
- Atera Networks Ltd.
- Automox Inc.
- baramundi software GmbH
- ConnectWise, LLC
- GFI USA, LLC
- Heimdal Security A/S
- Ivanti, Inc.
- NinjaOne
- Kaseya Inc.
- N-able Technologies Ltd.
- PDQ.com Corporation
- Qualys, Inc.
- SecPod Technologies Private Limited
- Tanium Inc.
- Vicarius Ltd.
Additional Benefits:
- The market estimate (ME) sheet in Excel format
- 3 months of analyst support
TABLE OF CONTENTS
1 INTRODUCTION
- 1.1 Study Assumptions and Market Definition
- 1.2 Scope of the Study
2 RESEARCH METHODOLOGY
3 EXECUTIVE SUMMARY
4 MARKET LANDSCAPE
- 4.1 Market Overview
- 4.2 Market Drivers
- 4.2.1 Escalating Exploitation of Known Vulnerabilities
- 4.2.2 Tightening Cyber Resilience and Compliance Mandates
- 4.2.3 Growth in Hybrid Work and Distributed Endpoints
- 4.2.4 Shift Toward Cloud-Native and Automated Patching
- 4.2.5 National Vulnerability Database Enrichment Gaps Are Forcing Risk-Based Patch Intelligence Adoption
- 4.2.6 Explosion of Third-Party Application Sprawl and Browser-Based Exposure
- 4.3 Market Restraints
- 4.3.1 Patch Compatibility and Business Downtime Risk
- 4.3.2 Legacy Systems and Fragmented Endpoint Estates
- 4.3.3 Incomplete Vulnerability Context for Mid-Severity Vulnerabilities
- 4.3.4 Virtual Patching and Compensating Controls Can Delay Full Remediation Spend
- 4.4 Impact of Macroeconomic Factors on the Market
- 4.5 Industry Value Chain Analysis
- 4.6 Regulatory Landscape
- 4.7 Technological Outlook
- 4.8 Porter's Five Forces Analysis
- 4.8.1 Bargaining Power of Suppliers
- 4.8.2 Bargaining Power of Buyers
- 4.8.3 Threat of New Entrants
- 4.8.4 Threat of Substitutes
- 4.8.5 Intensity of Competitive Rivalry
5 MARKET SIZE AND GROWTH FORECASTS (VALUE)
- 5.1 By Component
- 5.1.1 Software
- 5.1.1.1 Operating System Patch Management
- 5.1.1.2 Third-Party Application Patch Management
- 5.1.1.3 Cross-Platform Patch Automation and Analytics
- 5.1.2 Services
- 5.1.2.1 Professional Services
- 5.1.2.2 Managed Services
- 5.1.1 Software
- 5.2 By Deployment Mode
- 5.2.1 Cloud-Based
- 5.2.2 On-Premises
- 5.3 By Organization Size
- 5.3.1 Large Enterprises
- 5.3.2 Small and Medium Enterprises
- 5.4 By Industry Vertical
- 5.4.1 BFSI
- 5.4.2 IT and Telecom
- 5.4.3 Healthcare and Life Sciences
- 5.4.4 Government and Defense
- 5.4.5 Retail and E-commerce
- 5.4.6 Manufacturing
- 5.4.7 Energy and Utilities
- 5.4.8 Education
- 5.4.9 Other Industry Verticals
- 5.5 By Geography
- 5.5.1 North America
- 5.5.1.1 United States
- 5.5.1.2 Canada
- 5.5.1.3 Mexico
- 5.5.2 South America
- 5.5.2.1 Brazil
- 5.5.2.2 Argentina
- 5.5.2.3 Rest of South America
- 5.5.3 Europe
- 5.5.3.1 United Kingdom
- 5.5.3.2 Germany
- 5.5.3.3 France
- 5.5.3.4 Italy
- 5.5.3.5 Spain
- 5.5.3.6 Rest of Europe
- 5.5.4 Asia-Pacific
- 5.5.4.1 China
- 5.5.4.2 Japan
- 5.5.4.3 India
- 5.5.4.4 South Korea
- 5.5.4.5 Rest of Asia-Pacific
- 5.5.5 Middle East and Africa
- 5.5.5.1 Middle East
- 5.5.5.1.1 United Arab Emirates
- 5.5.5.1.2 Saudi Arabia
- 5.5.5.1.3 Rest of Middle East
- 5.5.5.2 Africa
- 5.5.5.2.1 South Africa
- 5.5.5.2.2 Egypt
- 5.5.5.2.3 Rest of Africa
- 5.5.5.1 Middle East
- 5.5.1 North America
6 COMPETITIVE LANDSCAPE
- 6.1 Market Concentration
- 6.2 Strategic Moves
- 6.3 Market Share Analysis
- 6.4 Company Profiles (includes Global Level Overview, Market Level Overview, Core Segments, Financials as available, Strategic Information, Market Rank/Share, Products and Services, Recent Developments)
- 6.4.1 Action1 Corporation
- 6.4.2 Addigy, Inc.
- 6.4.3 Acronis International GmbH
- 6.4.4 Adaptive Protocols, Inc.
- 6.4.5 Atera Networks Ltd.
- 6.4.6 Automox Inc.
- 6.4.7 baramundi software GmbH
- 6.4.8 ConnectWise, LLC
- 6.4.9 GFI USA, LLC
- 6.4.10 Heimdal Security A/S
- 6.4.11 Ivanti, Inc.
- 6.4.12 NinjaOne
- 6.4.13 Kaseya Inc.
- 6.4.14 N-able Technologies Ltd.
- 6.4.15 PDQ.com Corporation
- 6.4.16 Qualys, Inc.
- 6.4.17 SecPod Technologies Private Limited
- 6.4.18 Tanium Inc.
- 6.4.19 Vicarius Ltd.
7 MARKET OPPORTUNITIES AND FUTURE OUTLOOK
- 7.1 White-Space and Unmet-Need Assessment

