
PUBLISHER: Mordor Intelligence | PRODUCT CODE: 2064461

PUBLISHER: Mordor Intelligence | PRODUCT CODE: 2064461
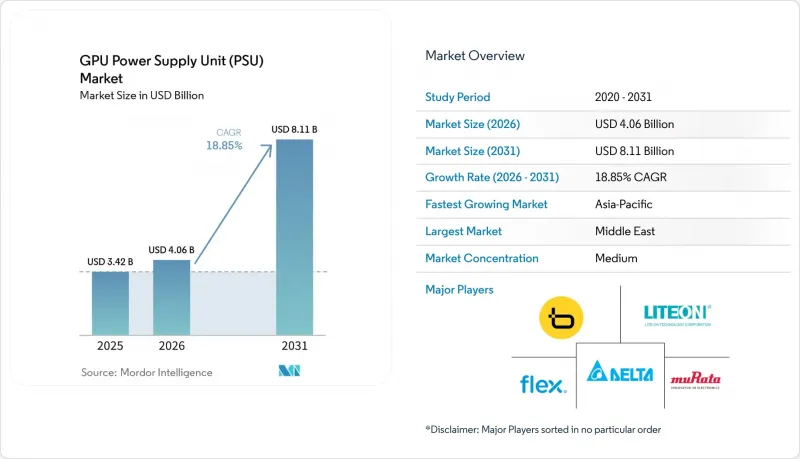
GPU Power Supply Unit (PSU) - Market Share Analysis, Industry Trends & Statistics, Growth Forecasts (2026 - 2031)
According to Mordor Intelligence, the gPU power supply unit market size is expected to increase from USD 3.42 billion in 2025 to USD 4.06 billion in 2026 and reach USD 8.11 billion by 2031, growing at a CAGR of 18.85% over 2026-2031.
This report is Segmented by Output Power Rating (Up To 1 KW, 1-2 KW, 2-3 KW, 3-5 KW, and Above 5 KW), Form Factor (CRPS, OCP PSUs, and Proprietary and Hyperscaler Custom Designs), End Application (GPU Accelerator Servers, AI Inference Servers, and HPC Systems), and Geography (North America, South America, Europe, Asia-Pacific, and Rest of the World). Market Forecasts are Provided in Value (USD).
Global GPU Power Supply Unit (PSU) Market Trends and Insights
Surge in AI-Driven Data Centers
Hyperscalers committed USD 103 billion in 2026 capital expenditures to support 4.5 gigawatts of contracted capacity and a further 9 gigawatts in pipeline projects, accelerating grid interconnection timelines from 36 months to 18 months. NVIDIA GB200 NVL72 racks now draw 120-140 kilowatts per cabinet, compelling PSU vendors to move from 1-2 kilowatt designs to modular 5-10 kilowatt units that couple directly with liquid manifolds. Retrofit economics favor greenfield builds because upgrading a legacy 10-megawatt site to AI densities costs operators USD 3-4 million per facility, compared with USD 16 million for a new build that avoids thermal trade-offs. Vendors are staging inventory near hyperscaler construction clusters in Virginia, Texas, and Singapore to secure a first-mover advantage, and Delta Electronics disclosed that AI-related PSUs accounted for 50% of its server-PSU revenue in Q4 2025.
Rapid Adoption of GPU-Based High-Performance Computing
Enterprise HPC clusters are mirroring hyperscaler architectures as firms deploy on-premises inference servers to avoid cloud egress costs. Dell's PowerEdge XE7745, launched in July 2025, integrates a 3,200-watt 80 PLUS Titanium PSU tailored for dual-GPU boards. Test-time compute scaling lifted per-query energy from 0.34 Wh to 4.32 Wh, forcing enterprises to double PSU capacity without increasing GPU count. Flex Ltd backed the trend by adding 1.134 million ft2 of capacity across Dallas, Colombia, and Poland in 2025, shortening lead times for custom orders. The convergence of cloud and enterprise specifications is compressing design cycles to 12 months, encouraging vendors to develop interoperable platforms that satisfy both Open Compute Project and proprietary racks.
Supply Chain Volatility in Gallium Nitride Components
China controls 98% of global gallium output, and 2024 export curbs doubled spot prices to USD 2,100 kg-1, inflating BOM costs for high-power PSUs. Innoscience scaled wafer fabrication to 15,000 eight-inch units per month at 97% yields, locking in deals with Google but exposing non-Chinese vendors to sudden embargo risk. Western suppliers are co-funding gallium-nitride epi-lines in Europe and North America, but commercial scale remains two to three years away, maintaining price volatility through 2027.
Other drivers and restraints analyzed in the detailed report include:
- Growing Demand for Liquid-Cooled Rack Architectures
- Integration of Digital Twin-Enabled PSU Monitoring
- Thermal Management Challenges Above 5 kW Output
For complete list of drivers and restraints, kindly check the Table Of Contents.
Segment Analysis
The 2-3 kilowatt category accounted for 42% of GPU power supply unit market revenue in 2025, underscoring its fit with existing 208/240 V power distribution and air cooling. Units above 5 kilowatts, however, are forecast to grow at a 20.04% CAGR through 2031 as hyperscalers standardize on 48 V backplanes and liquid manifolds to handle higher thermal loads. Navitas Semiconductor's 12-kilowatt blueprint validated 97.8% efficiency, establishing an aspirational ceiling for vendors still limited to 3.3-kilowatt silicon designs.
Enterprises upgrading inference clusters gravitate toward 3-5 kilowatt PSUs because they align with dual-GPU servers like Dell's PowerEdge XE7745. The GPU power supply unit market for the above-5-kilowatt tier is concentrated in North America, whereas Asia-Pacific data centers are retrofitting 2-3 kilowatt units to postpone capex. Certification costs under 80 PLUS Titanium, running USD 3,500-8,000 per SKU, delay launches in the highest-power bands, and disproportionately burden smaller vendors.
Geography Analysis
Asia-Pacific retained 63% revenue share in 2025, anchored by Taiwan's vertically integrated supply chain, where Delta Electronics, Lite-On Technology, and FSP Group collectively exceed 40% global output. Delta's Q4 2025 sales reached NTD 161.61 billion (USD 5.11 billion) with AI PSUs contributing 50% of server-power turnover. Innoscience's gallium nitride wafer-scale production secures priority access to raw materials, enabling Taiwanese assemblers to quote shorter lead times than their Western peers. Yet margin pressure is mounting as hyperscalers move design work in-house, relegating OEMs to build-to-print roles.
North America is projected to grow at a compound annual growth rate (CAGR) of 19.96% due to significant investments and developments by hyperscalers. These companies currently have 35 gigawatts of capacity under construction and have entered into a 10.5-gigawatt clean-energy agreement with Brookfield, which will span from 2026 to 2030. Additionally, Duke Energy has allocated USD 103 billion to grid upgrades to accommodate increasing energy demand driven by artificial intelligence (AI) applications. Flex Ltd expanded its U.S. operations in 2025 by adding 534,000 square feet of manufacturing space, addressing the growing preference for localized production to mitigate geopolitical risks and ensure supply chain resilience.
Europe and South America are experiencing slower growth than North America, primarily due to fewer hyperscale campuses and stricter environmental permitting regulations. However, Europe's Ecodesign Directive is driving the adoption of 80 PLUS Titanium power supply units (PSUs), which are more energy-efficient and environmentally friendly. In contrast, the Middle East and Africa regions remain in the early stages of development, constrained by limited grid capacity and a heavy reliance on imported components. Despite these challenges, sovereign AI initiatives in countries like Saudi Arabia and the United Arab Emirates are fostering the establishment of first-wave data centers, signaling the beginning of growth in these regions.
- Delta Electronics Inc.
- Lite-On Technology Corporation
- Flex Ltd.
- Zippy Technology Corp.
- Murata Manufacturing Co. Ltd.
- AcBel Polytech Inc.
- FSP Group
- Advanced Energy Industries Inc.
- CUI Inc.
- Sea Sonic Electronics Co. Ltd.
- Shenzhen Great Wall Technology Co. Ltd.
- Super Flower Computer Inc.
- Chicony Power Technology Co. Ltd.
- Bel Power Solutions and Protection
- TDK-Lambda Corporation
- Mean Well Enterprises Co. Ltd.
- Coolisys Technologies Corp.
- AsusTek Computer Inc.
- Enermax Technology Corporation
- Corsair Gaming Inc.
Additional Benefits:
- The market estimate (ME) sheet in Excel format
- 3 months of analyst support
TABLE OF CONTENTS
1 INTRODUCTION
- 1.1 Study Assumptions and Market Definition
- 1.2 Scope of the Study
2 RESEARCH METHODOLOGY
3 EXECUTIVE SUMMARY
4 MARKET LANDSCAPE
- 4.1 Market Overview
- 4.2 Market Drivers
- 4.2.1 Surge in AI-Driven Data Centers
- 4.2.2 Rapid Adoption of GPU-Based High-Performance Computing
- 4.2.3 Growing Demand for Liquid-Cooled Rack Architectures
- 4.2.4 Integration of Digital Twin-Enabled PSU Monitoring
- 4.2.5 Increased Efficiency Mandates Under 80 PLUS Titanium and Beyond
- 4.2.6 Expansion of Hyperscaler In-House PSU Design Capabilities
- 4.3 Market Restraints
- 4.3.1 Supply Chain Volatility in Gallium Nitride (GaN) Components
- 4.3.2 Thermal Management Challenges Above 5 kW Output
- 4.3.3 Limited Retrofit Viability in Legacy Server Racks
- 4.3.4 High Certification Costs for Redundant Topologies
- 4.4 Impact of Macroeconomic Factors on the Market
- 4.5 Industry Value Chain Analysis
- 4.6 Regulatory Landscape
- 4.7 Technological Outlook
- 4.8 Porter's Five Forces Analysis
- 4.8.1 Bargaining Power of Suppliers
- 4.8.2 Bargaining Power of Buyers
- 4.8.3 Threat of New Entrants
- 4.8.4 Threat of Substitutes
- 4.8.5 Intensity of Competitive Rivalry
5 MARKET SIZE AND GROWTH FORECASTS (VALUE)
- 5.1 By Output Power Rating
- 5.1.1 Up to 1 kW
- 5.1.2 1-2 kW
- 5.1.3 2-3 kW
- 5.1.4 3-5 kW
- 5.1.5 Above 5 kW
- 5.2 By Form Factor
- 5.2.1 Common Redundant Power Supply (CRPS)
- 5.2.2 Open Compute Project (OCP) PSUs
- 5.2.3 Proprietary and Hyperscaler Custom Designs
- 5.3 By End Application
- 5.3.1 GPU Accelerator Servers
- 5.3.2 AI Inference Servers
- 5.3.3 HPC Systems
- 5.4 By Geography
- 5.4.1 North America
- 5.4.1.1 United States
- 5.4.1.2 Canada
- 5.4.1.3 Mexico
- 5.4.2 South America
- 5.4.2.1 Brazil
- 5.4.2.2 Argentina
- 5.4.2.3 Rest of South America
- 5.4.3 Europe
- 5.4.3.1 United Kingdom
- 5.4.3.2 Germany
- 5.4.3.3 Rest of Europe
- 5.4.4 Asia-Pacific
- 5.4.4.1 China
- 5.4.4.2 Japan
- 5.4.4.3 India
- 5.4.4.4 South Korea
- 5.4.4.5 Rest of Asia-Pacific
- 5.4.5 Rest of the World
- 5.4.1 North America
6 COMPETITIVE LANDSCAPE
- 6.1 Market Concentration
- 6.2 Strategic Moves
- 6.3 Market Share Analysis
- 6.4 Company Profiles (includes Global Level Overview, Market Level Overview, Core Segments, Financials as available, Strategic Information, Market Rank/Share, Products and Services, Recent Developments)
- 6.4.1 Delta Electronics Inc.
- 6.4.2 Lite-On Technology Corporation
- 6.4.3 Flex Ltd.
- 6.4.4 Zippy Technology Corp.
- 6.4.5 Murata Manufacturing Co. Ltd.
- 6.4.6 AcBel Polytech Inc.
- 6.4.7 FSP Group
- 6.4.8 Advanced Energy Industries Inc.
- 6.4.9 CUI Inc.
- 6.4.10 Sea Sonic Electronics Co. Ltd.
- 6.4.11 Shenzhen Great Wall Technology Co. Ltd.
- 6.4.12 Super Flower Computer Inc.
- 6.4.13 Chicony Power Technology Co. Ltd.
- 6.4.14 Bel Power Solutions and Protection
- 6.4.15 TDK-Lambda Corporation
- 6.4.16 Mean Well Enterprises Co. Ltd.
- 6.4.17 Coolisys Technologies Corp.
- 6.4.18 AsusTek Computer Inc.
- 6.4.19 Enermax Technology Corporation
- 6.4.20 Corsair Gaming Inc.
7 MARKET OPPORTUNITIES AND FUTURE OUTLOOK
- 7.1 White-Space and Unmet-Need Assessment

