
PUBLISHER: Mordor Intelligence | PRODUCT CODE: 2065482

PUBLISHER: Mordor Intelligence | PRODUCT CODE: 2065482
United States Middle Mile Delivery - Market Share Analysis, Industry Trends & Statistics, Growth Forecasts (2026 - 2031)
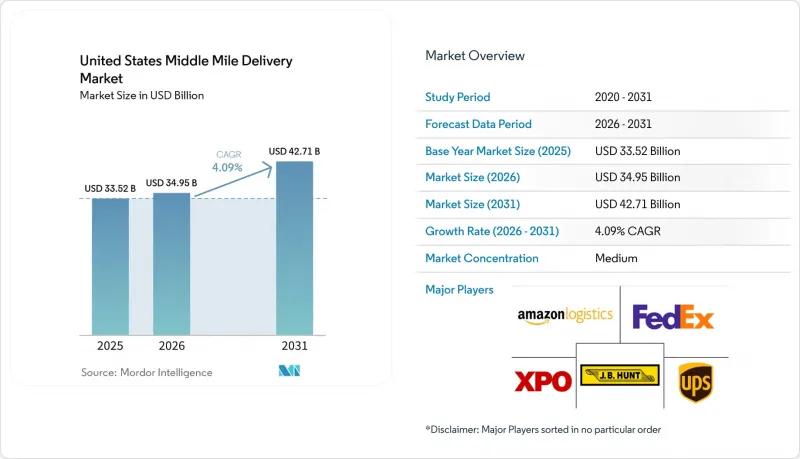
According to Mordor Intelligence, the united states middle mile delivery market size is projected to be USD 33.52 billion in 2025, USD 34.95 billion in 2026, and reach USD 42.71 billion by 2031, growing at a CAGR of 4.09% from 2026 to 2031.
This report is Segmented by Transportation Mode (Roadways, Railways, and More), by Business Model (B2B, B2C, and C2C), by Temperature, (Non-Temperature and Temperature Controlled), by Destination, (domestic and International), by End User (E-Commerce, Fashion, and More), and by Region (Northeast, Southeast, and More). The Market Size and Forecasts are Provided in Terms of Value (USD).
United States Middle Mile Delivery Market Trends and Insights
E-Commerce Order Densification Across Tier-2 US Metros
United States e-commerce sales reached USD 1,233.7 billion in 2025, accounting for 16.4% of total retail sales, confirming that online demand is still expanding from a very large base. Rising online volumes in tier-2 metros are pushing cities such as Columbus, Indianapolis, and San Antonio toward the order density needed to support dedicated shuttle lanes between hub nodes. Once that threshold is crossed, freight no longer needs to wait for longer-haul consolidation, improving trailer turns and supporting more predictable middle-mile schedules. That change opens new revenue streams for carriers, allowing them to flex between LTL and full-shuttle loads without overbuilding fixed capacity. The United States middle-mile delivery market benefits because these lanes sit between large fulfillment assets and local delivery networks, where recurring frequency matters more than maximum line-haul distance.
AI-Driven Dynamic Line-Haul Routing Platforms Scaling in LTL Networks
AI-led line-haul planning is moving from testing into daily network operations across the United States middle-mile delivery market. In January 2026, C.H. Robinson said its AI agents automated 95% of LTL missed-pickup checks, saved more than 350 manual hours each day, reduced unnecessary return trips by 42%, and helped some freight move up to 1 day faster. These tools help carriers fill trailers more effectively, cut empty miles, and tighten pickup discipline across dense corridors. They also change the competitive landscape, as smaller operators without strong data assets or software depth face weaker margins on lanes where dynamic routing is becoming standard. As this capability spreads, value is shifting away from pure physical scale and toward the quality of lane data, shipment history, and execution feedback that carriers can apply in real time.
Acute Class-A Driver Shortages Escalating Recruitment Costs
Driver availability remains a near-term restraint for the United States middle-mile delivery market, especially on overnight and longer regional lanes that still rely on hard-to-fill Class-A roles. Rising recruitment expense and persistent turnover make it harder for carriers to scale capacity in step with demand, even when freight volumes support new routes. Training and compliance requirements also lengthen the time required to bring new drivers into regular service, limiting how quickly operators can respond during peak periods. This pressure favors carriers that can offer shorter, more predictable middle-mile schedules, as those routes better meet retention needs than long-haul operations. The result is a labor market in which service consistency depends as much on driver access as on physical network coverage.
Other drivers and restraints analyzed in the detailed report include:
- Infrastructure Investment and Jobs Act Funding for Freight Corridors
- OEM-Led Roll-Out of Autonomous Middle-Mile Truck Pilots on I-10 & I-35
- Chronic Truck-Parking Deficit at Interstate Rest Areas
For complete list of drivers and restraints, kindly check the Table Of Contents.
Segment Analysis
Roadways held 65.81% of the United States middle-mile delivery market share in 2025, keeping them at the center of inter-hub operations because they can serve both dense and thin routes with the same base asset class. Their lead also reflects how e-commerce networks depend on flexible dispatch, frequent reloads, and direct access between fulfillment centers, cross-docks, and local sort points. Highway upgrades supported by federal funding further strengthen road mode economics on corridors where dwell, congestion, and interchange delays had reduced trailer productivity. For most operators, road freight remains the default choice when shipment timing changes quickly or when freight needs to be redirected across multiple regional nodes on the same day.
Airways are projected to grow at a 6.91% CAGR through 2026-2031, the fastest pace among transportation modes, reflecting the need for speed in pharmaceutical and high-value electronics flows. Railways remain a smaller part of the mix, but they are gaining attention on service-sensitive lanes where improved reliability can narrow the gap with truckload service. In November 2025, Schneider launched Fast Track. This premium intermodal, the company said, delivered 95% or better on-time performance and transit times up to 2 days faster than truckload alternatives on key US-Mexico routes. Maritime links still matter around port gateways and for short coastal moves, but in the United States middle-mile delivery market, they play a more limited role than road and air in day-to-day network balancing.
B2C accounted for 71.5% of the United States middle-mile delivery market in 2025, underscoring how online retail continues to shape freight movements between fulfillment sites and local delivery nodes. This segment benefits from a broad product base across apparel, electronics, home goods, and household replenishment, which creates recurring regional volumes throughout the year. Its scale also supports dense shuttle operations that can be reset quickly during holiday peaks or promotional periods. Because B2C demand is spread across many origin-destination pairs, it provides carriers with a broad load base that helps justify dedicated corridor planning.
C2C is forecast to grow at a 6.08% CAGR through 2026-2031, the fastest among business models, as resale platforms and peer-to-peer commerce generate more lightweight parcel clusters that still need middle-mile consolidation. These flows are smaller at the shipment level, but they become attractive once platform volumes are grouped into consistent regional movements. B2B remains an important stabilizer for the US middle-mile delivery market because manufacturer and supplier freight provides a predictable cadence that supports asset planning even when consumer volumes fluctuate. The mix of B2C scale, C2C growth, and B2B stability is pushing operators to design networks that can handle both steady contract lanes and variable platform-driven loads without raising empty mileage.
List of Companies Covered in this Report:
- United Parcel Service (UPS)
- FedEx
- Amazon Logistics
- XPO
- J.B. Hunt Transport Services
- Schneider National
- Knight-Swift Transportation
- Old Dominion Freight Line
- C.H. Robinson Worldwide
- ArcBest Corporation
- Hub Group
- Ryder System
- Lineage Logistics
- DSV
- Penske Logistics
- Werner Enterprises
- Estes Express Lines
- Saia
- GXO Logistics
- GEODIS
- Kuehne + Nagel
- TFI International
Additional Benefits:
- The market estimate (ME) sheet in Excel format
- 3 months of analyst support
TABLE OF CONTENTS
1 Introduction
- 1.1 Study Assumptions & Market Definition
- 1.2 Scope of the Study
2 Research Methodology
3 Executive Summary
4 Market Landscape
- 4.1 Market Overview
- 4.2 Market Drivers
- 4.2.1 E-Commerce Order Densification Across Tier-2 US Metros
- 4.2.2 AI-Driven Dynamic Line-Haul Routing Platforms Scaling in LTL Networks
- 4.2.3 Infrastructure Investment and Jobs Act Funding for Freight Corridors
- 4.2.4 Decentralized Micro-Fulfillment Hubs Shortening Regional Replenishment Loops
- 4.2.5 OEM-Led Roll-Out of Autonomous Middle-Mile Truck Pilots on I-10 & I-35
- 4.2.6 Railroads Launching Premium Expedited Intermodal Services (Less than 600-Mile Lanes)
- 4.3 Market Restraints
- 4.3.1 Acute Class-A Driver Shortages Escalating Recruitment Costs
- 4.3.2 Chronic Truck-Parking Deficit at Interstate Rest Areas
- 4.3.3 Port and Rail Yard Dwell-Time Volatility Post-2021 Congestion
- 4.3.4 Capital Intensity of Temperature-Controlled Cross-Dock Networks
- 4.4 Regulatory Framework
- 4.5 Value Chain and Distribution Channel Analysis
- 4.6 Technology Innovations Outlook
- 4.7 Porter's Five Forces
- 4.7.1 Threat of New Entrants
- 4.7.2 Bargaining Power of Suppliers
- 4.7.3 Bargaining Power of Buyers
- 4.7.4 Threat of Substitutes
- 4.7.5 Rivalry Among Competitors
- 4.8 Insights on Warehousing & Distribution Centers
- 4.9 Insights on Refrigerated Middle-Mile Delivery
- 4.10 Impact of Geo-Political Events on Supply Chain Shifts
5 Market Size & Growth Forecasts (Value, 2026-2031)
- 5.1 By Transportation Mode
- 5.1.1 Roadways
- 5.1.2 Railways
- 5.1.3 Airways
- 5.1.4 Maritime
- 5.2 By Business Model
- 5.2.1 Business-to-Business (B2B)
- 5.2.2 Business-to-Consumer (B2C)
- 5.2.3 Customer-to-Consumer (C2C)
- 5.3 By Temperature Control
- 5.3.1 Non-Temperature Controlled
- 5.3.2 Temperature Controlled
- 5.4 By Destination
- 5.4.1 Domestics
- 5.4.2 International
- 5.5 By End User Industry
- 5.5.1 E-commerce Retail
- 5.5.2 Fashion and Lifestyle
- 5.5.3 Beauty, Wellness and Personal Care
- 5.5.4 Home and Furniture
- 5.5.5 Consumer Electronics and Appliances
- 5.5.6 Healthcare and Medical Supplies
- 5.5.7 Others
- 5.6 By Region
- 5.6.1 Northeast
- 5.6.2 Southeast
- 5.6.3 Midwest
- 5.6.4 Southwest
- 5.6.5 West
6 Competitive Landscape
- 6.1 Market Concentration
- 6.2 Key Strategic Moves
- 6.3 Market Share Analysis
- 6.4 Company Profiles (includes Global level Overview, Market level overview, Core Segments, Financials as available, Strategic Information, Market Rank/Share for key companies, Products & Services, and Recent Developments)
- 6.4.1 United Parcel Service (UPS)
- 6.4.2 FedEx
- 6.4.3 Amazon Logistics
- 6.4.4 XPO
- 6.4.5 J.B. Hunt Transport Services
- 6.4.6 Schneider National
- 6.4.7 Knight-Swift Transportation
- 6.4.8 Old Dominion Freight Line
- 6.4.9 C.H. Robinson Worldwide
- 6.4.10 ArcBest Corporation
- 6.4.11 Hub Group
- 6.4.12 Ryder System
- 6.4.13 Lineage Logistics
- 6.4.14 DSV
- 6.4.15 Penske Logistics
- 6.4.16 Werner Enterprises
- 6.4.17 Estes Express Lines
- 6.4.18 Saia
- 6.4.19 GXO Logistics
- 6.4.20 GEODIS
- 6.4.21 Kuehne + Nagel
- 6.4.22 TFI International
7 Market Opportunities & Future Outlook
- 7.1 White-space & Unmet-Need Assessment

