
PUBLISHER: Mordor Intelligence | PRODUCT CODE: 2065497

PUBLISHER: Mordor Intelligence | PRODUCT CODE: 2065497
GPU Server - Market Share Analysis, Industry Trends & Statistics, Growth Forecasts (2026 - 2031)
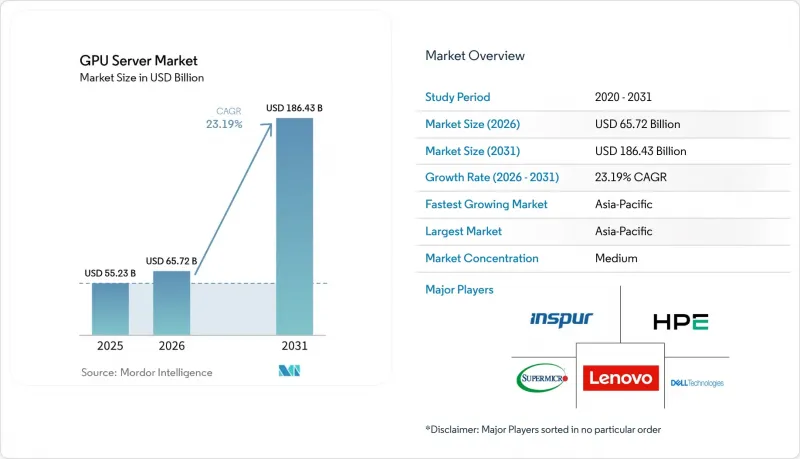
According to Mordor Intelligence, the gPU server market size was valued at USD 55.23 billion in 2025 and estimated to grow from USD 65.72 billion in 2026 to reach USD 186.43 billion by 2031, at a CAGR of 23.19% during the forecast period (2026-2031).
This report is Segmented by Deployment (Data Center, Edge), Workload (AI Training, AI Inference, and More), Configuration (Single GPU, and Multi-GPU), Form Factor (Rack, Blade, and More), GPU Integration (PCIe-Based, SXM/NVLink-based, and More), End-User (Cloud Service Providers, Enterprise, Government and Research Institutions, and More), and Geography. The Market Forecasts are Provided in Terms of Value (USD).
Global GPU Server Market Trends and Insights
Surging Demand for AI Training Capacity in Hyperscale Data Centers
Hyperscale operators are rolling out clusters containing more than 100,000 accelerators to train frontier models with parameter counts exceeding 1 trillion, a scale that requires investment in dedicated substations and high-capacity interconnects. Meta aims to operate roughly 600,000 H100-class GPUs, while Microsoft's USD 80 billion fiscal-2026 plan steers billions toward liquid-cooled racks. Power-purchase agreements stretching 10-20 years are locking in 50-100 megawatts per campus. Sovereign AI policies in the European Union and the Middle East are driving incremental demand by requiring local hosting of sensitive training data. Collectively, these moves lift the base of training capacity, extending multi-year visibility for GPU server orders.
Generative AI Boom Driving GPU Server Refresh Cycles
Enterprises have trimmed the traditional four-year server life cycle to barely two, swapping CPU-heavy nodes for GPU accelerators to run chatbots, code assistants, and multimodal content tools. Dell reported a doubling of GPU server bookings in fiscal 2025, and HPE posted 35% growth in AI-optimized systems. The debut of NVIDIA's Blackwell and AMD's MI300 families, each offering 2-3X the performance per watt, creates a financial case for retiring hardware installed just 2 years ago. Enterprises also need larger memory footprints to support multimodal models, driving purchases of servers equipped with the latest GPUs.
Supply Chain Constraints for Advanced Packaging Substrates
CoWoS capacity at TSMC expanded by 50% in 2025 yet remained oversubscribed, with booking queues stretching into the first half of 2026. SK Hynix kept HBM3 lines fully allocated, forcing NVIDIA and AMD to ration flagship parts. U.S. curbs on shipments of packaging equipment to China compound the risk by centralizing production in Taiwan and South Korea. The shortfall delays enterprise deliveries by up to 9 months, stalling data center buildouts and compressing revenue visibility for OEMs.
Other drivers and restraints analyzed in the detailed report include:
- Deployment of Large-Language-Model Inference at the Network Edge
- Shift Toward Liquid-Cooled High-Density Racks
- Escalating TCO Due to Soaring Data-Center Power Tariffs
For complete list of drivers and restraints, kindly check the Table Of Contents.
Segment Analysis
Edge installations accounted for a modest slice of the GPU server market share in 2025. However, this segment is projected to grow at a robust CAGR of 23.59%, gradually reducing the dominance of data centers, which commanded 88.21% of the revenue in the base year. This growth is primarily driven by the adoption of 5G-enabled monetization models that prioritize sub-10-millisecond response times and local data processing, making edge installations increasingly relevant in the evolving market landscape. Despite this growth, data-center deployments are expected to remain the cornerstone of the GPU server market through 2031. This is largely due to hyperscale training clusters that rely on thousands of GPUs per hall to handle intensive computational tasks.
Nevertheless, the edge segment is expanding faster, particularly in regions such as South Korea, Japan, and densely populated metropolitan areas in India. These regions face challenges such as limited real estate availability and the need for user proximity, making edge installations a more viable solution. The market is witnessing the emergence of two distinct supply chains: low-power single-GPU nodes housed in rugged enclosures for edge applications, and 16-GPU liquid-cooled racks designed for core data center campuses. This differentiation highlights the diverse requirements and applications driving the GPU server market forward.
AI inference revenue is projected to climb at a 23.99% CAGR, significantly outpacing the broader GPU server market and surpassing the growth rates of training. In 2025, training accounted for 53.47% of total revenue; however, the volume of daily inference queries for tools such as ChatGPT had already exceeded the number of training epochs by a substantial margin. This shift highlights the growing demand for inference capabilities in real-world applications, as businesses and consumers increasingly rely on AI-driven solutions for a range of tasks. The maturation of AI models is a key driver of this trend. Once a multimodal foundation model is trained, it enables the development of thousands of customer-facing applications across various industries, ranging from healthcare and finance to retail and entertainment.
These applications require low-latency inference to deliver seamless, efficient user experiences. In response to this growing demand, hardware vendors have introduced accelerator SKUs specifically optimized for INT8 and FP8 arithmetic, which deliver 2-3X the throughput per watt compared to FP16 training cards. These advancements in hardware technology are enabling more efficient and cost-effective inference operations. As a result, the GPU server market segment associated with inference is expected to surpass training revenue before the end of the decade, marking a significant shift in market dynamics and highlighting the evolving priorities within the AI ecosystem.
Geography Analysis
Asia-Pacific dominated the GPU server market share at 67.63% in 2025 and is projected to record a 24.19% CAGR to 2031. China's pivot to domestic GPUs, illustrated by Huawei's Ascend 910C shipments, partially offsets curtailed H200 imports. India's data-center pipeline broke the 1 gigawatt mark, with Yotta committing USD 2 billion to triple GPU hall capacity by 2027. Japan earmarked JPY 100 billion (USD 690 million) for an exascale successor to Fugaku, emphasizing GPU acceleration for AI and climate research. South Korea budgeted KRW 500 billion (USD 375 million) to build a national AI compute backbone, pairing domestic HBM3 with imported GPUs.
North America accounted for roughly 20% of 2025 revenue, underpinned by Meta, Microsoft, and Google pledging over USD 200 billion in AI infrastructure funding through 2026. Grid constraints in Northern Virginia lengthen interconnect queues, steering new construction into the Midwest and Mountain regions where renewable capacity is available. The U.S. also incubates edge deployments, though regional uptake lags Asia-Pacific on a per-subscriber basis.
Europe captured about 10% of revenue in 2025. High power tariffs averaging EUR 0.30 (USD 0.32) per kilowatt-hour and stringent carbon rules temper expansion, yet they also catalyze the adoption of liquid cooling. Operators pivot to Scandinavian markets for cheaper hydro power, while sovereign AI requirements inside the EU keep a baseline of in-region GPU demand. South America, the Middle East, and Africa remained sub-5% combined; however, Saudi Arabia and the United Arab Emirates are funding sovereign AI clusters that could lift regional share in the late forecast years.
- Dell Technologies Inc.
- Hewlett Packard Enterprise Company
- Lenovo Group Limited
- Super Micro Computer Inc.
- Inspur Group Co. Ltd.
- Huawei Technologies Co. Ltd.
- GIGABYTE Technology Co. Ltd.
- ASUSTeK Computer Inc.
- NVIDIA Corporation
- Advanced Micro Devices Inc.
- International Business Machines Corporation
- Fujitsu Limited
- Atos SE
- Penguin Computing Inc.
- TYAN Computer Corporation
- H3C Technologies Co. Ltd.
- BOXX Technologies LLC
- Lambda Labs Inc.
- NEC Corporation
- Sugon Information Industry Co. Ltd.
Additional Benefits:
- The market estimate (ME) sheet in Excel format
- 3 months of analyst support
TABLE OF CONTENTS
1 INTRODUCTION
- 1.1 Study Assumptions and Market Definition
- 1.2 Scope of the Study
2 RESEARCH METHODOLOGY
3 EXECUTIVE SUMMARY
4 MARKET LANDSCAPE
- 4.1 Market Overview
- 4.2 Market Drivers
- 4.2.1 Surging Demand for AI Training Capacity in Hyperscale Data Centers
- 4.2.2 Generative AI Boom Driving GPU Server Refresh Cycles
- 4.2.3 Rising Adoption of GPU-Accelerated Databases in FinTech and Retail
- 4.2.4 Government-Funded Exascale HPC Programs
- 4.2.5 Deployment of Large-Language-Model Inference at the Network Edge
- 4.2.6 Shift Toward Liquid-Cooled High-Density Racks
- 4.3 Market Restraints
- 4.3.1 Supply Chain Constraints for Advanced Packaging Substrates
- 4.3.2 Escalating TCO Due to Soaring Data-Center Power Tariffs
- 4.3.3 Geopolitical Export Controls on High-End GPUs
- 4.3.4 Skills Gap in Parallel Programming for Heterogeneous Systems
- 4.4 Impact of Macroeconomic Factors on the Market
- 4.5 Industry Value Chain Analysis
- 4.6 Regulatory Landscape
- 4.7 Technological Outlook
- 4.8 Porter's Five Forces Analysis
- 4.8.1 Bargaining Power of Suppliers
- 4.8.2 Bargaining Power of Buyers
- 4.8.3 Threat of New Entrants
- 4.8.4 Threat of Substitutes
- 4.8.5 Intensity of Competitive Rivalry
5 MARKET SIZE AND GROWTH FORECASTS (VALUE)
- 5.1 By Deployment
- 5.1.1 Data Center
- 5.1.2 Edge
- 5.2 By Workload
- 5.2.1 AI Training
- 5.2.2 AI Inference
- 5.2.3 HPC
- 5.2.4 Visualization
- 5.3 By Configuration
- 5.3.1 Single GPU
- 5.3.2 Multi-GPU (2-4)
- 5.4 By Form Factor
- 5.4.1 Rack
- 5.4.2 Blade
- 5.4.3 Modular
- 5.5 By GPU Integration
- 5.5.1 PCIe-based
- 5.5.2 SXM / NVLink-based
- 5.5.3 OAM-based
- 5.6 By End-User
- 5.6.1 Cloud Service Providers (Hyperscalers)
- 5.6.2 Enterprise
- 5.6.3 Government and Research Institutions
- 5.6.4 Telecom / Edge Operators
- 5.7 By Geography
- 5.7.1 North America
- 5.7.1.1 United States
- 5.7.1.2 Canada
- 5.7.1.3 Mexico
- 5.7.2 Europe
- 5.7.2.1 United Kingdom
- 5.7.2.2 Germany
- 5.7.2.3 France
- 5.7.2.4 Rest of Europe
- 5.7.3 Asia-Pacific
- 5.7.3.1 China
- 5.7.3.2 Japan
- 5.7.3.3 India
- 5.7.3.4 South Korea
- 5.7.3.5 Rest of Asia-Pacific
- 5.7.4 South America
- 5.7.5 Middle East and Africa
- 5.7.1 North America
6 COMPETITIVE LANDSCAPE
- 6.1 Market Concentration
- 6.2 Strategic Moves
- 6.3 Market Share Analysis
- 6.4 Company Profiles (includes Global Level Overview, Market Level Overview, Core Segments, Financials as available, Strategic Information, Market Rank/Share, Products and Services, Recent Developments)
- 6.4.1 Dell Technologies Inc.
- 6.4.2 Hewlett Packard Enterprise Company
- 6.4.3 Lenovo Group Limited
- 6.4.4 Super Micro Computer Inc.
- 6.4.5 Inspur Group Co. Ltd.
- 6.4.6 Huawei Technologies Co. Ltd.
- 6.4.7 GIGABYTE Technology Co. Ltd.
- 6.4.8 ASUSTeK Computer Inc.
- 6.4.9 NVIDIA Corporation
- 6.4.10 Advanced Micro Devices Inc.
- 6.4.11 International Business Machines Corporation
- 6.4.12 Fujitsu Limited
- 6.4.13 Atos SE
- 6.4.14 Penguin Computing Inc.
- 6.4.15 TYAN Computer Corporation
- 6.4.16 H3C Technologies Co. Ltd.
- 6.4.17 BOXX Technologies LLC
- 6.4.18 Lambda Labs Inc.
- 6.4.19 NEC Corporation
- 6.4.20 Sugon Information Industry Co. Ltd.
7 MARKET OPPORTUNITIES AND FUTURE OUTLOOK
- 7.1 White-Space and Unmet-Need Assessment

