
PUBLISHER: Mordor Intelligence | PRODUCT CODE: 2065522

PUBLISHER: Mordor Intelligence | PRODUCT CODE: 2065522
GPU Accelerator Card - Market Share Analysis, Industry Trends & Statistics, Growth Forecasts (2026 - 2031)
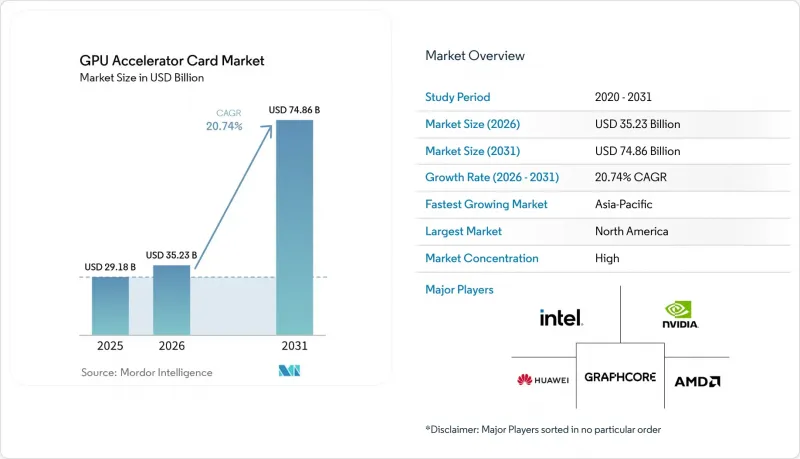
According to Mordor Intelligence, the gPU accelerator card market size is expected to increase from USD 29.18 billion in 2025 to USD 35.23 billion in 2026 and reach USD 74.86 billion by 2031, growing at a CAGR of 20.74% over 2026-2031.
This report is Segmented by Form Factor (PCIe Add-In Cards, SXM/Mezzanine, and OAM), Memory Type (HBM, and GDDR), Cooling (Passive, Aand Active), Deployment (Data Center/Server, Workstation, and Edge/Embedded), Industry Vertical (Cloud Service Providers, Enterprise IT, Government and Research, Media and Entertainment, and More), and Geography. The Market Forecasts are Provided in Terms of Value (USD).
Global GPU Accelerator Card Market Trends and Insights
Explosive Growth in AI And Machine Learning Training Workloads
Model parameter counts have jumped from 1.8 trillion to over 10 trillion, requiring clusters with more than 100,000 accelerators and interconnect fabrics exceeding 400 Gbps per GPU. Frontier systems at U.S. national laboratories now integrate more than 28,000 NVIDIA H100 units, while hyperscalers each spent over USD 70 billion expanding AI capacity in 2025. Training jobs demand sustained utilization near 90%, reshaping total cost-of-ownership assumptions and locking in long multi-year hardware pipelines. Pre-training costs exceeding USD 100 million per run have narrowed participation to capital-intensive firms, thereby fortifying demand across the GPU accelerator card market. The resulting pressure keeps premium parts supply-constrained, sustaining high average selling prices even as volumes climb.
Surging Adoption of Cloud Gaming and Streaming Platforms
Cloud gaming revenues hit USD 8.5 billion in 2025, and leading platforms now target 4 K at 240 fps with sub-40 ms latency. Providers confront sharp evening peaks that create three-to-one utilization swings, so many routes idle overnight capacity toward generative AI inference to lift asset use from 35% to 65%. Latency budgets under 50 ms require edge data centers within 20 ms of end users, driving demand for compact, passively cooled accelerators that tolerate remote operation. As competitive esports titles migrate to cloud delivery, every millisecond of delay becomes a risk of customer churn, accelerating refresh cycles in the GPU accelerator card market.
Persistent Supply Chain Constraints in Advanced Substrates
Ajinomoto Build-up Film substrates remain fully booked through 2027, stretching lead times to 52 weeks. NVIDIA, AMD, and Intel hold multiyear allocations from the same pool of Taiwanese and Korean suppliers, crowding out smaller entrants. The 2024 Taiwan earthquake highlighted the fragility of this node, as it paused production for 6 weeks and lengthened global scheduling by another quarter. Because substrates form up to one-fifth of a board's bill of materials, price spikes ripple directly to end cards, creating a headwind for the GPU accelerator card market.
Other drivers and restraints analyzed in the detailed report include:
- Accelerated Enterprise Roll-Outs of Generative AI Applications
- Rising Demand for High-Performance Computing in Academia and Government
- High Total Cost of Ownership of Datacenter GPU Infrastructure
For complete list of drivers and restraints, kindly check the Table Of Contents.
Segment Analysis
OAM modules posted a 21.34% CAGR from 2026 to 2031, while the PCIe add-in card GPU accelerator market commanded 52% of revenue in 2025. OAM lets hyperscalers pack 72 accelerators drawing 1.4 MW into a 42U rack, shrinking floor space 40% compared with PCIe equivalents. Meta and its peers standardized on direct-liquid-cooled OAM designs that handle 700-W GPUs, enhancing power efficiency by 25%. In contrast, enterprises prize PCIe's hot-swappable flexibility, which still anchors procurement cycles for firms upgrading a few servers at a time.
The efficiency delta translates into materially lower cost per floating-point operation at massive scale, so OAM's installed base will keep climbing in hyperscale facilities. Yet the GPU accelerator card market remains bifurcated because smaller organizations hesitate to rebuild racks around 700-W liquid-cooling loops. SXM modules, embedded primarily in NVIDIA's DGX systems, hold a 28% share and will maintain niche demand among users who value proprietary NVLink bandwidth over open standards.
HBM attained 84% of 2025 revenue and remains the fulcrum of competitive positioning, with the GPU accelerator card market share segment anchored by supply from SK Hynix, Samsung, and Micron. Each HBM3e stack now delivers 1.15 TB/s, and top devices couple eight or more stacks for 8 TB/s aggregate bandwidth. Model sizes keep rising faster than Moore's law gains, so buyers willingly pay the 8x premium over GDDR6.
GDDR-backed cards continue to serve workstations and edge inference, where cost per GB trumps peak bandwidth, retaining a 16% share. HBM4 is scheduled for 2027 and promises 2 TB/s per stack, potentially easing the bottleneck but likely at even higher unit costs initially. Until fresh capacity in South Korea and the United States reaches volume scale in 2028, HBM supply will constrain overall growth in the GPU accelerator card market.
Geography Analysis
North America accounted for 46% of 2025 revenue, driven by hyperscaler outlays exceeding USD 300 billion. However, the regional compound annual growth rate (CAGR) is projected at a below-average 19.8%, primarily due to delays in grid interconnections and challenges in obtaining power permits, which are slowing further datacenter buildouts. In Canada, hydro-powered provinces have attracted investments totaling USD 8 billion for the construction of new data halls. Meanwhile, the U.S. export regime, which restricts the sale of advanced GPUs to China, has redirected excess demand domestically. This redirection has helped maintain elevated GPU prices in the region.
Asia-Pacific is set to grow at 21.82% CAGR, the fastest among regions. Japan allocated JPY 4 trillion (USD 26 billion) to AI research infrastructure, India's INR 103.07 billion (USD 1.24 billion) mission will add 10,000 GPUs, and Singapore targets 50 PFLOPS with a USD 500 million buildout. China's domestic vendors, shielded from export restrictions, shipped USD 8 billion worth of accelerators in 2025, while South Korea's dominance in HBM supply cements the area's strategic heft in the GPU accelerator card market.
Europe captured 18% share in 2025, helped by EuroHPC investments in exascale systems across Germany, Italy, and Spain. New directives requiring power-usage effectiveness below 1.3 and 80% renewable sourcing by 2028 drive demand for energy-efficient GPUs. France also requires carbon accounting for training jobs above 10 PF-days, which privileges hyperscalers with established reporting infrastructure. South America and the Middle East and Africa collectively held 8% share, backed by sovereign wealth fund commitments in Brazil, the United Arab Emirates, and Saudi Arabia. Limited grid capacity and specialist workforce shortages curb near-term acceleration, yet long-distance cable upgrades and modular nuclear pilots could unlock latent demand post-2028.
- NVIDIA Corporation
- Advanced Micro Devices, Inc.
- Intel Corporation
- Huawei Technologies Co., Ltd. (Ascend Series)
- Graphcore Ltd.
- Tenstorrent Inc.
- Qualcomm Technologies, Inc.
- Samsung Electronics Co., Ltd.
- Alibaba Group Holding Limited (T-Head)
- Baidu, Inc. (Kunlun)
- Cerebras Systems Inc.
- Advanced Micro Devices, Inc. (Xilinx VCK, Radeon Instinct)
- Giga Computing Technology Co., Ltd.
- Mellanox Technologies Ltd. (NVIDIA Networking)
- Broadcom Inc.
- ASUStek Computer Inc.
- Dell Technologies Inc.
- Hewlett Packard Enterprise Company
- Lenovo Group Limited
- Super Micro Computer, Inc.
- Inspur Group Co., Ltd.
Additional Benefits:
- The market estimate (ME) sheet in Excel format
- 3 months of analyst support
TABLE OF CONTENTS
1 INTRODUCTION
- 1.1 Study Assumptions and Market Definition
- 1.2 Scope of the Study
2 RESEARCH METHODOLOGY
3 EXECUTIVE SUMMARY
4 MARKET LANDSCAPE
- 4.1 Market Overview
- 4.2 Market Drivers
- 4.2.1 Explosive Growth in AI and Machine Learning Training Workloads
- 4.2.2 Surging Adoption of Cloud Gaming and Streaming Platforms
- 4.2.3 Accelerated Enterprise Roll-outs of Generative AI Applications
- 4.2.4 Rising Demand for High-Performance Computing in Academia and Government
- 4.2.5 EU Sustainability Rules Accelerating Procurement of Energy-Efficient GPUs
- 4.2.6 Open Accelerator Module (OAM) Standard Enabling Multi-Vendor Interoperability
- 4.3 Market Restraints
- 4.3.1 Persistent Supply Chain Constraints in Advanced Substrates
- 4.3.2 High Total Cost of Ownership of Datacenter GPU Infrastructure
- 4.3.3 HBM Capacity Bottlenecks Limiting Board-Level Memory Expansion
- 4.3.4 Export-Control Restrictions Curtailing Cross-Border GPU Shipments
- 4.4 Impact of Macroeconomic Factors on the Market
- 4.5 Industry Value Chain Analysis
- 4.6 Regulatory Landscape
- 4.7 Technological Outlook
- 4.8 Porter's Five Forces Analysis
- 4.8.1 Bargaining Power of Suppliers
- 4.8.2 Bargaining Power of Buyers
- 4.8.3 Threat of New Entrants
- 4.8.4 Threat of Substitutes
- 4.8.5 Intensity of Competitive Rivalry
5 MARKET SIZE AND GROWTH FORECASTS (VALUE)
- 5.1 By Form Factor
- 5.1.1 PCIe Add-In Cards
- 5.1.2 SXM / Mezzanine
- 5.1.3 OAM
- 5.2 By Memory Type
- 5.2.1 HBM
- 5.2.2 GDDR
- 5.3 By Cooling
- 5.3.1 Passive
- 5.3.2 Active
- 5.4 By Deployment
- 5.4.1 Data Center / Server
- 5.4.2 Workstation
- 5.4.3 Edge / Embedded
- 5.5 By Industry Vertical
- 5.5.1 Cloud Service Providers
- 5.5.2 Enterprise IT
- 5.5.3 Government and Research
- 5.5.4 Media and Entertainment
- 5.5.5 Automotive / Edge AI
- 5.6 By Geography
- 5.6.1 North America
- 5.6.1.1 United States
- 5.6.1.2 Canada
- 5.6.1.3 Mexico
- 5.6.2 Europe
- 5.6.2.1 United Kingdom
- 5.6.2.2 Germany
- 5.6.2.3 France
- 5.6.2.4 Rest of Europe
- 5.6.3 Asia-Pacific
- 5.6.3.1 China
- 5.6.3.2 Japan
- 5.6.3.3 India
- 5.6.3.4 South Korea
- 5.6.3.5 Rest of Asia Pacific
- 5.6.4 South America
- 5.6.5 Middle East and Africa
- 5.6.1 North America
6 COMPETITIVE LANDSCAPE
- 6.1 Market Concentration
- 6.2 Strategic Moves
- 6.3 Market Share Analysis
- 6.4 Company Profiles (includes Global Level Overview, Market Level Overview, Core Segments, Financials as available, Strategic Information, Market Rank/Share, Products and Services, Recent Developments)
- 6.4.1 NVIDIA Corporation
- 6.4.2 Advanced Micro Devices, Inc.
- 6.4.3 Intel Corporation
- 6.4.4 Huawei Technologies Co., Ltd. (Ascend Series)
- 6.4.5 Graphcore Ltd.
- 6.4.6 Tenstorrent Inc.
- 6.4.7 Qualcomm Technologies, Inc.
- 6.4.8 Samsung Electronics Co., Ltd.
- 6.4.9 Alibaba Group Holding Limited (T-Head)
- 6.4.10 Baidu, Inc. (Kunlun)
- 6.4.11 Cerebras Systems Inc.
- 6.4.12 Advanced Micro Devices, Inc. (Xilinx VCK, Radeon Instinct)
- 6.4.13 Giga Computing Technology Co., Ltd.
- 6.4.14 Mellanox Technologies Ltd. (NVIDIA Networking)
- 6.4.15 Broadcom Inc.
- 6.4.16 ASUStek Computer Inc.
- 6.4.17 Dell Technologies Inc.
- 6.4.18 Hewlett Packard Enterprise Company
- 6.4.19 Lenovo Group Limited
- 6.4.20 Super Micro Computer, Inc.
- 6.4.21 Inspur Group Co., Ltd.
7 MARKET OPPORTUNITIES AND FUTURE OUTLOOK
- 7.1 White-Space and Unmet-Need Assessment

