
PUBLISHER: Mordor Intelligence | PRODUCT CODE: 2066377

PUBLISHER: Mordor Intelligence | PRODUCT CODE: 2066377
Polyurethane - Market Share Analysis, Industry Trends & Statistics, Growth Forecasts (2026 - 2031)
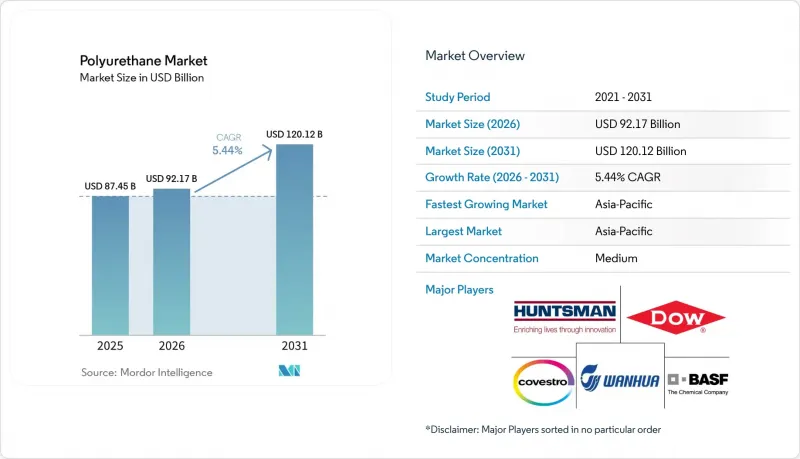
According to Mordor Intelligence, the polyurethane market size is projected to be USD 87.45 billion in 2025, USD 92.17 billion in 2026, and reach USD 120.12 billion by 2031, growing at a CAGR of 5.44% from 2026 to 2031.
This report is Segmented by Raw Material (Methylene Diphenyl Di-Isocyanate (MDI), Toluene Di-Isocyanate (TDI), and Others), Type (Rigid Foam, Flexible Foam, and Others), End-User Industry (Building and Construction, Furniture, and Others), and Geography (Asia-Pacific, North America, Europe, South America, and Middle East and Africa). The Market Forecasts are Provided in Terms of Value (USD).
Global Polyurethane Market Trends and Insights
Growing Demand from Automotive Lightweighting
Automakers are replacing steel and aluminum with polyurethane composites to meet the European Union's 93.6 g/km fleet-average CO2 target for 2025 and the United States' corporate average fuel-economy standard of 49 mpg for 2026. BASF's spray-transfer molding cut the Ford F-150 Lightning front crossmember mass by 30% without sacrificing crash safety. Jeep's Grand Cherokee 4xe uses a polyurethane composite tailgate that is 18% lighter than stamped steel, and Toyota trims 2.4 kg per Tundra hybrid using polyurethane seat frames. Each kilogram saved extends battery-electric-vehicle range by 1-2 km, a benefit that amplifies as battery packs grow.
Booming Building and Construction Insulation Demand
Directive 2024/1275 obliges EU members to report life-cycle global-warming potential for insulation and mandates zero-operational-emission buildings by 2030. Rigid polyurethane foam, with thermal conductivity of 0.022 W/m*K, enables thin-wall retrofits where floor-space premiums are high. The U.S. EPA's hydrofluorocarbon phase-down caps blowing agents at GWP 150 from 2025, pushing formulators toward costlier hydrofluoroolefins . Saudi Arabia's USD 144.3 billion 2024 contract awards specify rigid polyurethane panels for desert passive-house performance. Together, these policies lift demand faster than flexible foam, explaining the 1.5 percentage-point boost to the polyurethane market CAGR despite rising production costs.
Volatile Isocyanate Feedstock Prices
MDI and TDI prices declined 18-22% year-on-year in April 2025 as Chinese overcapacity met muted downstream demand. ResourceWise confirmed sustained weakness in November 2025, compelling integrated producers to curb rates. Smaller converters, exposed to spot markets, face feedstock swings that can equal 60% of cost of goods. Demand destruction ensues when spikes prompt builders to delay projects or shift to mineral wool, knocking 0.9 percentage points from the polyurethane market CAGR.
Other drivers and restraints analyzed in the detailed report include:
- Surge in High-Resilience Furniture and Bedding Foams
- Adoption of PU in Offshore Wind Turbine Blades and Nacelle Covers
- Tightening Global PFAS and Di-Isocyanate Exposure Regulations
For complete list of drivers and restraints, kindly check the Table Of Contents.
Segment Analysis
Methylene diphenyl di-isocyanate secured 38.17% of polyurethane market share in 2025, underscoring its position in rigid insulation and thermoplastic polyurethane. TDI remains essential for flexible furniture foam, though oversupply has suppressed prices since mid-2024. Polyether and polyester polyols fill mainstream formulations, while bio-based polyols advance at a 12.60% CAGR on the back of Cargill soybean oils and Covestro cardyon CO2 technology. The resulting mix points to a future where conventional feedstocks protect volume through economies of scale, and renewable polyols capture niches demanding verified low carbon footprints.
Bio-polyol penetration aligns with EU Scope 3 reporting and U.S. brand commitments, lifting margins despite a 20-30% cost premium. Covestro's inaugural commercial cardyon(R) grades incorporate 20% captured CO2, illustrating how process innovation can offset fossil-based intermediates and differentiate offerings. Polyester polyols gain share in wind-turbine resin infusion and automotive adhesive films where aromatic chemistry enhances UV stability. Meanwhile, price-driven TDI dynamics force Western producers to rationalize assets, evidenced by Dow's European strategic review. The polyurethane market absorbs these shifts by balancing low-cost Asian isocyanates with high-margin specialty systems in North America and Europe.
Geography Analysis
Asia-Pacific captured 47.05% of polyurethane market revenue in 2025 and is set for a 6.80% CAGR to 2031 as Wanhua expands MDI capacity by another 400,000 tpa at Ningbo and eyes a similar addition in Fujian by 2027. China's dominance rests on integrated coal-to-aniline routes, while India's 25.9 million vehicle output in fiscal 2024 drives dual demand for seat foam and building insulation. ASEAN construction booms in Indonesia and Vietnam augment regional pull on flexible-foam imports. Japan and South Korea, though mature, pioneer bio-based polyols to meet corporate net-zero pledges.
In North America, housing starts remain 20% below 2020 highs, muting rigid-foam momentum. The EPA's GWP 150 limit adds USD 0.15-0.25 per board foot to costs, pressuring smaller spray-foam applicators. Canada's climate-zone codes require R-30-40 walls, steering builders toward high-performance foams. Mexico benefits from nearshoring of appliances and electronics, stimulating demand for both flexible and rigid polyurethane systems.
Europe sits at a crossroads where Directive 2024/1275 underpins a renovation wave, but elevated energy and compliance costs erode producer competitiveness. Residential permits fell 8% in 2024, yet Nordic retrofit incentives cover 40% of insulation costs, spurring spray-foam demand. REACH exposure limits compel investments that favor integrated multinationals, while Dow's asset review hints at potential consolidation.
South America and the Middle East and Africa hinge on mega-projects. Saudi Arabia's USD 144.3 billion in 2024 awards includes passive-house-spec rigid panels for NEOM. The UAE's USD 81.3 billion contract slate boosts spray-foam waterproofing in tunneling. Brazil and Argentina recover flexible-foam demand as consumer credit loosens. Nigeria deploys rigid foam in pharmaceutical cold-chain warehouses, signaling embryonic but strategic growth nodes.
- BASF
- Carpenter Co.
- Covestro AG
- DIC Corporation
- Dow
- FoamPartner Group
- FXI
- Huntsman International LLC
- INOAC Corporation
- LANXESS
- Lubrizol
- Mitsui Chemicals Inc.
- Rogers Corporation
- Rymbal
- Sekisui Chemical Co., Ltd.
- Sheela Foam Ltd.
- Tosoh Corporation
- UFP Technologies, Inc.
- Wanhua
Additional Benefits:
- The market estimate (ME) sheet in Excel format
- 3 months of analyst support
TABLE OF CONTENTS
1 Introduction
- 1.1 Study Assumptions and Market Definition
- 1.2 Scope of the Study
2 Research Methodology
3 Executive Summary
4 Market Landscape
- 4.1 Market Overview
- 4.2 Market Drivers
- 4.2.1 Growing Demand from Automotive Lightweighting
- 4.2.2 Booming Building and Construction Insulation Demand
- 4.2.3 Surge in High-Resilience Furniture and Bedding Foams
- 4.2.4 Adoption of PU in Offshore Wind Turbine Blades And Nacelle Covers
- 4.2.5 Mass-Customization of Footwear Using PU Additive Manufacturing
- 4.3 Market Restraints
- 4.3.1 Volatile Isocyanate Feedstock Prices
- 4.3.2 Tightening Global PFAS and Di-Isocyanate Exposure Regulations
- 4.3.3 Competition from Bio-Based Thermoplastic Polymers
- 4.4 Value Chain Analysis
- 4.5 Porter's Five Forces
- 4.5.1 Bargaining Power of Suppliers
- 4.5.2 Bargaining Power of Buyers
- 4.5.3 Threat of New Entrants
- 4.5.4 Threat of Substitute Products and Services
- 4.5.5 Degree of Competition
5 Market Size and Growth Forecasts (Value)
- 5.1 By Raw Material
- 5.1.1 Methylene Diphenyl Di-isocyanate (MDI)
- 5.1.2 Toluene Di-isocyanate (TDI)
- 5.1.3 Polyether Polyols
- 5.1.4 Polyester Polyols
- 5.1.5 Bio-based Polyols
- 5.2 By Type
- 5.2.1 Rigid Foam
- 5.2.2 Flexible Foam
- 5.2.3 CASE (Coatings, Adhesives, Sealants and Elastomers)
- 5.2.4 Thermoplastic Polyurethane (TPU)
- 5.2.5 Other Types (Spray Polyurethane Foam (SPF), etc.)
- 5.3 By End-user Industry
- 5.3.1 Building and Construction
- 5.3.2 Furniture
- 5.3.3 Electronics and Appliances
- 5.3.4 Automotive
- 5.3.5 Footwear
- 5.3.6 Packaging
- 5.3.7 Other End-user Industries (Healthcare, Industrial Machinery, etc.)
- 5.4 By Geography
- 5.4.1 Asia-Pacific
- 5.4.1.1 China
- 5.4.1.2 India
- 5.4.1.3 Japan
- 5.4.1.4 South Korea
- 5.4.1.5 ASEAN Countries
- 5.4.1.6 Rest of Asia-Pacific
- 5.4.2 North America
- 5.4.2.1 United States
- 5.4.2.2 Canada
- 5.4.2.3 Mexico
- 5.4.3 Europe
- 5.4.3.1 Germany
- 5.4.3.2 United Kingdom
- 5.4.3.3 France
- 5.4.3.4 Italy
- 5.4.3.5 Spain
- 5.4.3.6 NORDIC Countries
- 5.4.3.7 Rest of Europe
- 5.4.4 South America
- 5.4.4.1 Brazil
- 5.4.4.2 Argentina
- 5.4.4.3 Rest of South America
- 5.4.5 Middle East and Africa
- 5.4.5.1 Saudi Arabia
- 5.4.5.2 South Africa
- 5.4.5.3 United Arab Emirates
- 5.4.5.4 South Africa
- 5.4.5.5 Nigeria
- 5.4.5.6 Rest of Middle East and Africa
- 5.4.1 Asia-Pacific
6 Competitive Landscape
- 6.1 Market Concentration
- 6.2 Strategic Moves
- 6.3 Market Share(%)/Ranking Analysis
- 6.4 Company Profiles (includes Global level Overview, Market level overview, Core Segments, Financials as available, Strategic Information, Market Rank/Share for key companies, Products and Services, and Recent Developments)
- 6.4.1 BASF
- 6.4.2 Carpenter Co.
- 6.4.3 Covestro AG
- 6.4.4 DIC Corporation
- 6.4.5 Dow
- 6.4.6 FoamPartner Group
- 6.4.7 FXI
- 6.4.8 Huntsman International LLC
- 6.4.9 INOAC Corporation
- 6.4.10 LANXESS
- 6.4.11 Lubrizol
- 6.4.12 Mitsui Chemicals Inc.
- 6.4.13 Rogers Corporation
- 6.4.14 Rymbal
- 6.4.15 Sekisui Chemical Co., Ltd.
- 6.4.16 Sheela Foam Ltd.
- 6.4.17 Tosoh Corporation
- 6.4.18 UFP Technologies, Inc.
- 6.4.19 Wanhua
7 Market Opportunities and Future Outlook
- 7.1 White-space and Unmet-need Assessment

