
PUBLISHER: Mordor Intelligence | PRODUCT CODE: 2066436

PUBLISHER: Mordor Intelligence | PRODUCT CODE: 2066436
Cloud Security In Energy - Market Share Analysis, Industry Trends & Statistics, Growth Forecasts (2026 - 2031)
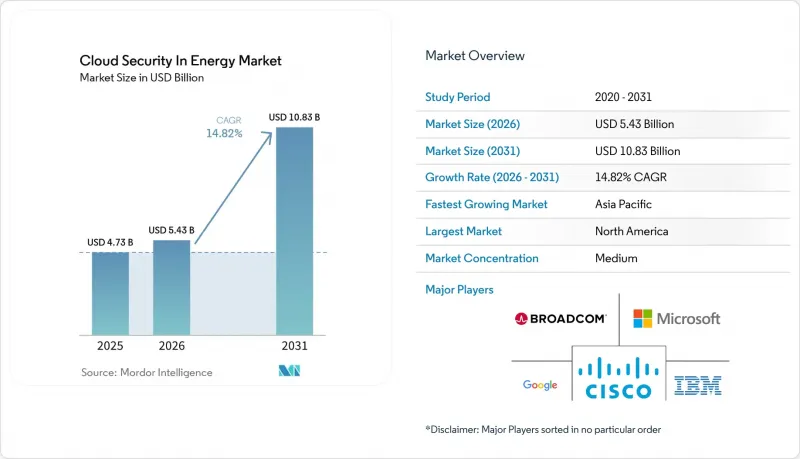
According to Mordor Intelligence, the cloud security in energy market size is expected to increase from USD 4.73 billion in 2025 to USD 5.43 billion in 2026 and reach USD 10.83 billion by 2031, growing at a CAGR of 14.82% over 2026-2031.
This report is Segmented by Solution Type (Identity and Access Management, Data Loss Prevention, and More), Security Type (Application Security, and More), Service Model (Infrastructure-As-A-Service, Platform-As-A-Service, and Software-As-A-Service), Deployment Type (Public Cloud, Private Cloud, and Hybrid Cloud), and Geography. Market Forecasts are Provided in Terms of Value (USD).
Global Cloud Security In Energy Market Trends and Insights
Increasing Number of Cyber Threats
Ransomware and state-sponsored campaigns surged in 2024, with 47 major incidents targeting North American utilities and pipelines, a 38% jump from the prior year. Attackers exploit gaps between legacy supervisory control and data acquisition assets and cloud analytics platforms, a seam where multi-factor authentication is still absent on many endpoints. Agencies such as the Cybersecurity and Infrastructure Security Agency have documented multi-year intrusions, like Volt Typhoon, that remained undetected in critical infrastructure for up to five years. Utilities now prioritize platforms that ingest operational technology telemetry, correlate it with identity data, and spot anomalous breaker commands before physical damage occurs. This demand is driving the adoption of Security Information and Event Management, reducing the mean time to detect and respond from hours to minutes.
Increasing Adoption of IoT Across the Supply Chain
The International Energy Agency reported 2.5 billion connected devices in global energy operations as of 2024, and the total is expected to exceed 4 billion by 2028. Pipelines, transformers, and offshore turbines generate constant telemetry that must be transmitted securely over public networks. Each unmanaged sensor introduces a new attack surface, as illustrated by the 2024 Mirai variant, which co-opted 180,000 energy devices in a distributed denial-of-service attack. Operators now insist on device attestation, encrypted data-in-transit, and policy enforcement at the edge, channeling funds toward cloud platforms capable of onboarding and securing millions of field sensors at scale. These controls also support predictive maintenance programs that boost uptime and reduce truck rolls.
Shortage of Skilled Cloud Security Professionals in Operational Technology
In 2024, 68% of U.S. electric utilities lacked personnel fluent in both industrial protocols and cloud controls, according to the Department of Energy. The talent gap necessitates a heavier reliance on managed service providers, yet many external teams lack the operational experience necessary for zero-downtime environments. Asia Pacific faces similar deficits: India alone needs 15,000 additional operational technology security specialists by 2030. Utilities increasingly outsource detection and response, but third-party access expands the chain of trust and mandates rigorous contract oversight, ultimately constraining near-term adoption velocity.
Other drivers and restraints analyzed in the detailed report include:
- Rising Integration of Smart Grid and Distributed Energy Resources
- Growing Regulatory Mandates for Zero-Trust Architectures in Critical Infrastructure
- Sovereign Cloud Compliance and Data Residency Constraints
For complete list of drivers and restraints, kindly check the Table Of Contents.
Segment Analysis
The segment generated the strongest growth outlook, with Security Information and Event Management tools forecast to expand at a 15.96% CAGR. This pace reflects the sector's shift from standalone firewalls to analytics that integrate firewall logs, supervisory control and data acquisition alarms, and identity signals. Identity and Access Management still held 24.78% revenue share in 2025, underscoring the continuing need for foundational credential controls. The cloud security in energy market size for Security Information and Event Management solutions is set to double by 2031 as utilities adopt pre-built correlation packs that flag unauthorized breaker trips or turbine shutdown commands. Vendors such as Splunk and IBM integrate energy-specific rules, compressing incident investigation cycles to minutes.
Security spending on Data Loss Prevention, Intrusion Detection Systems, and Encryption rounds out the solution stack. In upstream oil and gas, Data Loss Prevention protects seismic models valued at billions, preventing inadvertent exposure via misconfigured storage buckets. Operational technology-aware Intrusion Detection Systems now inspect Modbus and DNP3 traffic for abnormal register writes. Encryption remains mandatory for edge-to-cloud pathways: utilities are refreshing libraries to align with post-quantum standards finalized in 2024. Collectively, these tools underpin a defense-in-depth posture that can handle the heightened threat tempo without increasing headcount.
Application Security is projected to grow at 17.28% as utilities modernize monolithic supervisory control and data acquisition human-machine interfaces into microservices. While Network Security retained a 34.68% share in 2025, its share is being diluted as enforcement shifts from the perimeter to application programming interface (API) gateways and service meshes. The cloud security in energy sector market share for Application Security is widening because every distributed energy resource aggregator connects through application programming interface (API) calls that must be rate-limited, input-sanitized, and OAuth-authenticated. The Open Web Application Security Project ranked broken object-level authorization as the top risk for 2024, an acute concern for grid operators that dispatch power across dynamic endpoints.
Database, Endpoint, and Email controls complement this progression. Database Security protects trading desks where millisecond latency drives profit; tokenization and field-level encryption defend sensitive bids. Extended detection and response on endpoints detects anomalous field engineer behavior before data exfiltration occurs. Email gateways block spear-phishing campaigns, which, according to the Cybersecurity and Infrastructure Security Agency, accounted for 62% of breaches in 2024. Together, these layers tighten the zero-trust perimeter around every asset, identity, and workload.
Geography Analysis
North America held a 39.72% share in 2025, propelled by the North American Electric Reliability Corporation's Critical Infrastructure Protection regulations and federal funding. The U.S. Department of Energy allocated USD 3.5 billion in 2024 for grid modernization, stipulating advanced cybersecurity controls. Canada followed with a similar mandate, and Mexico's market liberalization led to greenfield deployments that adopted zero-trust from day one. Utilities in the region heavily rely on Security Information and Event Management (SIEM) and Identity and Access Management (IAM) solutions to meet audit benchmarks, and the presence of hyperscale data centers accelerates the adoption of these technologies. Despite its maturity, the region remains vulnerable to ransomware, which continues to drive high investment levels.
Asia Pacific is forecast to grow at 16.32%, the fastest regional pace. China's plan to achieve 1,200 gigawatts of renewable energy by 2030 drives massive cloud adoption, exemplified by State Grid's 2024 deployment, which covers 1.1 billion customers. India's Smart Grid Mission and Japan's resilience agenda are bolstering demand for hybrid cloud, which combines on-premises sovereignty with burst capacity. Australia mandates multi-factor authentication and encrypted links for all market participants, further lifting security budgets. Skills shortages, however, pose a brake, pushing utilities toward managed services.
Europe, South America, the Middle East, and Africa form the remainder. Europe enforces the toughest compliance regime under the NIS2 and the Cyber Resilience Act, prompting utilities to adopt continuous monitoring. Germany's Energiewende created over 2 million distributed energy resources, demanding secure onboarding. Brazil's 2024 resolution requires annual penetration tests and the deployment of Security Information and Event Management (SIEM). In the Middle East, megaprojects such as NEOM in Saudi Arabia specify cloud-native operational technology security from the blueprint stage. African nations are deploying solar mini-grids with embedded controls, thereby bypassing legacy technical debt and opening direct paths to cloud-first architectures.
- Amazon Web Services Inc.
- Microsoft Corporation
- IBM Corporation
- Cisco Systems Inc.
- Palo Alto Networks Inc.
- Fortinet Inc.
- Check Point Software Technologies Ltd.
- Trend Micro Incorporated
- McAfee Corp.
- Broadcom Inc.
- Google LLC
- Dell Technologies Inc.
- Zscaler Inc.
- Tenable Holdings Inc.
- Qualys Inc.
- Rapid7 Inc.
- Netskope Inc.
- CrowdStrike Holdings Inc.
- Okta Inc.
- Imperva Inc.
- Darktrace plc
- Nozomi Networks Inc.
- Dragos Inc.
- Claroty Ltd.
- Schneider Electric SE
- Siemens AG
Additional Benefits:
- The market estimate (ME) sheet in Excel format
- 3 months of analyst support
TABLE OF CONTENTS
1 INTRODUCTION
- 1.1 Study Assumptions and Market Definition
- 1.2 Scope of the Study
2 RESEARCH METHODOLOGY
3 EXECUTIVE SUMMARY
4 MARKET LANDSCAPE
- 4.1 Market Overview
- 4.2 Market Drivers
- 4.2.1 Increasing Adoption of IoT Across the Supply Chain
- 4.2.2 Increasing Number of Cyber Threats
- 4.2.3 Rising Integration of Smart Grid and Distributed Energy Resources
- 4.2.4 Growing Regulatory Mandates for Zero-Trust Architectures in Critical Infrastructure
- 4.2.5 Emergence of Cloud-Native Operational Technology Security Platforms Specific to Energy
- 4.2.6 Declining Costs of Edge-to-Cloud Secure Connectivity Solutions Enabled by 5G Private Networks
- 4.3 Market Restraints
- 4.3.1 Integration with Existing Architecture
- 4.3.2 Shortage of Skilled Cloud Security Professionals in Operational Technology
- 4.3.3 Sovereign Cloud Compliance and Data Residency Constraints
- 4.3.4 High Perceived Cost of Continuous Cloud Security Posture Management
- 4.4 Industry Value Chain Analysis
- 4.5 Regulatory Landscape
- 4.6 Technological Outlook
- 4.7 Porter's Five Forces Analysis
- 4.7.1 Threat of New Entrants
- 4.7.2 Bargaining Power of Buyers or Consumers
- 4.7.3 Bargaining Power of Suppliers
- 4.7.4 Threat of Substitute Products
- 4.7.5 Intensity of Competitive Rivalry
- 4.8 Impact of Macroeconomic Factors on the Market
5 MARKET SIZE AND GROWTH FORECASTS (VALUE)
- 5.1 By Solution Type
- 5.1.1 Identity and Access Management
- 5.1.2 Data Loss Prevention
- 5.1.3 IDS or IPS
- 5.1.4 Security Information and Event Management
- 5.1.5 Encryption
- 5.1.6 Other Solution Type
- 5.2 By Security Type
- 5.2.1 Application Security
- 5.2.2 Database Security
- 5.2.3 Endpoint Security
- 5.2.4 Network Security
- 5.2.5 Web and Email Security
- 5.2.6 Other Security Type
- 5.3 By Service Model
- 5.3.1 Infrastructure-as-a-Service
- 5.3.2 Platform-as-a-Service
- 5.3.3 Software-as-a-Service
- 5.4 By Deployment Type
- 5.4.1 Public Cloud
- 5.4.2 Private Cloud
- 5.4.3 Hybrid Cloud
- 5.5 By Geography
- 5.5.1 North America
- 5.5.1.1 United States
- 5.5.1.2 Canada
- 5.5.1.3 Mexico
- 5.5.2 South America
- 5.5.2.1 Brazil
- 5.5.2.2 Argentina
- 5.5.2.3 Rest of South America
- 5.5.3 Europe
- 5.5.3.1 United Kingdom
- 5.5.3.2 Germany
- 5.5.3.3 France
- 5.5.3.4 Italy
- 5.5.3.5 Spain
- 5.5.3.6 Russia
- 5.5.3.7 Rest of Europe
- 5.5.4 Asia Pacific
- 5.5.4.1 China
- 5.5.4.2 Japan
- 5.5.4.3 India
- 5.5.4.4 South Korea
- 5.5.4.5 Australia
- 5.5.4.6 Rest of Asia Pacific
- 5.5.5 Middle East
- 5.5.5.1 Saudi Arabia
- 5.5.5.2 United Arab Emirates
- 5.5.5.3 Turkey
- 5.5.5.4 Rest of Middle East
- 5.5.6 Africa
- 5.5.6.1 South Africa
- 5.5.6.2 Nigeria
- 5.5.6.3 Egypt
- 5.5.6.4 Rest of Africa
- 5.5.1 North America
6 COMPETITIVE LANDSCAPE
- 6.1 Market Concentration
- 6.2 Strategic Moves
- 6.3 Market Share Analysis
- 6.4 Company Profiles (includes Global Level Overview, Market Level Overview, Core Segments, Financials as Available, Strategic Information, Market Rank or Share for Key Companies, Products and Services, and Recent Developments)
- 6.4.1 Amazon Web Services Inc.
- 6.4.2 Microsoft Corporation
- 6.4.3 IBM Corporation
- 6.4.4 Cisco Systems Inc.
- 6.4.5 Palo Alto Networks Inc.
- 6.4.6 Fortinet Inc.
- 6.4.7 Check Point Software Technologies Ltd.
- 6.4.8 Trend Micro Incorporated
- 6.4.9 McAfee Corp.
- 6.4.10 Broadcom Inc.
- 6.4.11 Google LLC
- 6.4.12 Dell Technologies Inc.
- 6.4.13 Zscaler Inc.
- 6.4.14 Tenable Holdings Inc.
- 6.4.15 Qualys Inc.
- 6.4.16 Rapid7 Inc.
- 6.4.17 Netskope Inc.
- 6.4.18 CrowdStrike Holdings Inc.
- 6.4.19 Okta Inc.
- 6.4.20 Imperva Inc.
- 6.4.21 Darktrace plc
- 6.4.22 Nozomi Networks Inc.
- 6.4.23 Dragos Inc.
- 6.4.24 Claroty Ltd.
- 6.4.25 Schneider Electric SE
- 6.4.26 Siemens AG
7 MARKET OPPORTUNITIES AND FUTURE OUTLOOK
- 7.1 White-Space and Unmet-Need Assessment

