
PUBLISHER: Mordor Intelligence | PRODUCT CODE: 2066458

PUBLISHER: Mordor Intelligence | PRODUCT CODE: 2066458
Submarine - Market Share Analysis, Industry Trends & Statistics, Growth Forecasts (2026 - 2031)
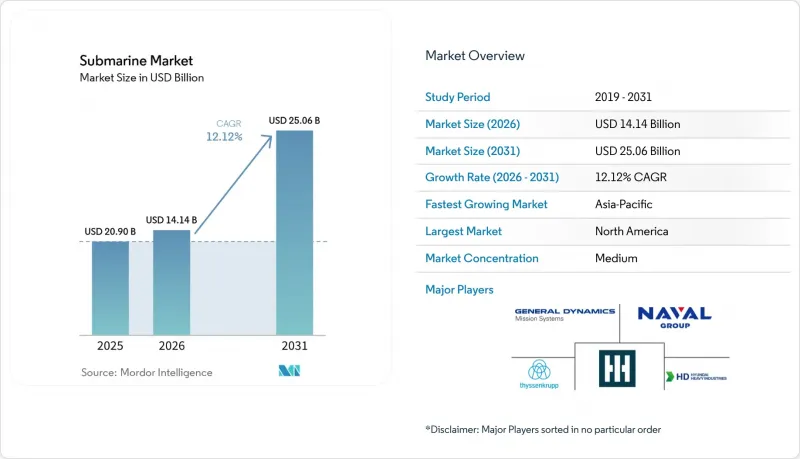
According to Mordor Intelligence, the submarine market size was valued at USD 20.90 billion in 2025 and is estimated to grow from USD 14.14 billion in 2026 to reach USD 25.06 billion by 2031, at a CAGR of 12.12% during the forecast period 2026-2031.
This report is Segmented by Propulsion Type (Nuclear-Powered and Diesel-Electric Submarines), Combat Role (Attack, Ballistic-Missile, and More), Displacement Class (Less Than 2, 000 Tons, 2, 000 To 4, 000 Tons, and More), Component (Hull and Structural Modules, Propulsion Systems, and More), and Geography (North America, Europe, Asia-Pacific, and More). The Market Forecasts are Provided in Terms of Value (USD).
Global Submarine Market Trends and Insights
Rising Defense Modernization Budgets Catalyze Submarine Procurement
The submarine market is benefiting from defense budget growth directed toward platforms with strategic persistence, survivability, and deterrence value. The US FY2026 Department of Defense (DoD) budget requested USD 12.2 billion for Virginia-class boats and USD 11.5 billion for Columbia-class boats. Northern Europe is also reinforcing the order book, with Norway raising its Type 212CD order to 6 boats under a NOK 46 billion (USD 4.5 billion) package, bringing the combined German-Norwegian program to 12 boats. The demand cycle is stronger than in the 2010s because nuclear recapitalization and conventional procurement are moving together rather than replacing one another in a staggered fashion. That overlap means authorizations are reaching shipyards faster than physical capacity is expanding, which delays recognition into later years, even when budgets have already been approved. In practical terms, the submarine market is being pushed upward by funding certainty, but the pace of realized revenue still depends on how quickly certified yards and suppliers can absorb that workload.
Escalating Indo-Pacific Maritime Tensions Drive Multi-Country Procurement
The submarine market is also being widened by a larger buyer base across the Indo-Pacific, where procurement is no longer limited to a few established operators. Tensions in the region are pushing more navies to treat submarines as central tools for sea denial, maritime surveillance, chokepoint control, and deterrence signaling. This shift matters because it expands demand beyond a handful of Tier-1 navies and creates overlapping acquisition schedules across China, India, Japan, South Korea, Australia, and Pakistan. The result is not only greater hull demand but also greater competition over technology transfer, local production, and combat-system integration. The procurement pattern is therefore becoming broader and less cyclical, which gives the submarine market a stronger demand base than one driven only by traditional nuclear operators. It also means future awards are more likely to be shaped by regional security alignment, industrial offsets, and delivery reliability rather than by platform performance alone.
Ultra-High Acquisition and Lifecycle Costs Cap Order Throughput
The submarine market remains constrained by the simple fact that modern submarine programs absorb a very large share of naval capital budgets. Congressional Research Service data placed the FY2026 Virginia-class procurement cost at USD 5 billion per boat, making it difficult to scale fleet plans even for major naval powers. The Congressional Budget Office estimated the Columbia-class program at USD 130 billion for 12 submarines and also projected higher long-run submarine spending pressure across the Navy's shipbuilding plan. This cost burden forces many navies to make hard tradeoffs between new builds, sustainment, missiles, and workforce support. In the submarine market, demand is real and strategic urgency is high, but order throughput still depends on what governments can fund over the full program life rather than at contract signing.
Other drivers and restraints analyzed in the detailed report include:
- AUKUS Pact Reshapes Allied Fleet Architecture and Supplier Roles
- AIP and Li-Ion Batteries Redefine The Diesel-Electric Submarine's Combat Value
- Skilled Labor Bottlenecks Constrain Western Build Rates
For complete list of drivers and restraints, kindly check the Table Of Contents.
Segment Analysis
Diesel-electric submarines accounted for 55.62% of the submarine market in 2025, keeping conventional propulsion as the largest revenue pool. That leadership reflects the broader number of active buyers across Asia-Pacific, Europe, and selected South American fleets, where conventional boats fit both budget limits and operating requirements. The segment benefits from mission flexibility, as these submarines are well-suited for coastal defense, chokepoint control, intelligence patrols, and special-forces insertion. The submarine market, therefore, still relies on conventional procurement for its volume base even as more attention shifts to nuclear recapitalization. This balance also explains why conventional programs remain commercially important for yards that do not participate in nuclear construction.
Nuclear-powered submarines are projected to grow at a 14.21% CAGR through 2031, making them the fastest-growing propulsion segment by value. Growth is being driven by high-ticket SSBN and SSN programs, where each boat carries a contract value much larger than that of a diesel-electric unit. In the submarine industry, this creates a two-speed structure in which conventional orders support breadth while nuclear awards drive value concentration. The technology gap is also becoming less pronounced as better batteries and AIP systems improve the endurance and combat relevance of advanced conventional boats. Within the submarine market, that means conventional propulsion should continue to hold the largest share, while nuclear propulsion captures a rising share of spending growth.
Attack submarines accounted for 48.70% of the submarine market size in 2025, supported by the large number of SSN and SSK programs now moving through procurement and delivery. Their lead reflects operational utility, as navies use attack boats for anti-surface warfare (ASuW), anti-submarine warfare (ASW), intelligence gathering, escort duties, and regional sea-denial missions. These boats also align with the broadest customer set, from advanced nuclear navies to countries buying diesel-electric fleets for national waters. The submarine market continues to rely on this role for installed fleet depth, as attack boats meet both peacetime and wartime requirements. That wide mission profile keeps the segment structurally resilient even when procurement timing shifts between programs.
Ballistic-missile submarines are forecast to expand at 13.13% CAGR through 2031, making them the fastest-growing combat role in value terms. Growth is tied to overlapping recapitalization cycles among nuclear-armed states, which is unusual because several deterrent fleets are being renewed within the same broad time window. The UK's Dreadnought program remains a great and sustained effort, with the House of Commons Library noting its scale and long delivery horizon. In the submarine industry, that overlap creates a concentrated wave of capital spending on a small number of very high-value platforms. For the submarine market, the result is a role mix in which attack boats lead on current revenue breadth while SSBNs drive the sharpest long-run value expansion.
Geography Analysis
North America accounted for 36.05% of the submarine market in 2025, making it the largest regional contributor to revenue. The region's position rests mainly on US procurement scale, long-cycle SSN and SSBN recapitalization, and sustained industrial-base funding. Congressional Research Service and CBO data together show that the US is committing large resources to submarine construction while still facing schedule pressure, supplier concentration, and workforce limits. Canada adds a meaningful future demand layer through the Canadian Patrol Submarine Project, where the government advanced the procurement process in August 2025. In the submarine market, North America combines the largest order values with the clearest evidence that industrial capacity is becoming a strategic constraint rather than a temporary execution issue.
Asia-Pacific is the fastest-growing region, with the submarine market expected to advance at 13.76% CAGR through 2031. Growth comes from simultaneous procurement and fleet expansion across China, India, Japan, South Korea, and Australia, giving the region an unmatched breadth of demand. The strategic environment is pushing countries to pursue a mix of indigenous development, foreign collaboration, and technology-transfer frameworks. That broadens the submarine market because the region is not growing from one national program alone, but from several large programs moving in parallel. It also increases competition among suppliers because each buyer assigns different weights to local construction, political alignment, delivery speed, and long-term sustainment.
Europe held a meaningful share of revenue in 2025 and remains one of the most program-dense regions in the submarine market. Germany and Norway expanded the 212CD program to 12 boats in total, while German shipyards have received federal support for upgrades to production capacity. Europe also shows how the submarine market can combine sovereign demand with export ambition, as several regional yards compete abroad while serving domestic naval programs. South America remains smaller in current value terms, but Brazil gives the region a visible long-horizon role through its conventional buildout and nuclear ambition. The Middle East and Africa still represent a modest share, yet infrastructure security concerns and regional naval modernization are supporting incremental interest in undersea capability.
- General Dynamics Mission Systems, Inc. (General Dynamics Corporation)
- Huntington Ingalls Industries, Inc.
- BAE Systems plc
- Naval Group
- thyssenkrupp Marine Systems GmbH (thyssenkrupp AG)
- HD Hyundai Heavy Industries Co. Ltd.
- Hanwha Corporation
- Mitsubishi Heavy Industries Ltd.
- Kawasaki Heavy Industries, Ltd.
- Saab AB
- NAVANTIA, S.A., SME
- Fincantieri S.p.A.
- United Shipbuilding Corporation
- China State Shipbuilding Corporation
- ASC Pty Ltd.
- PT PAL Indonesia
- SIMA PERU S.A.
Additional Benefits:
- The market estimate (ME) sheet in Excel format
- 3 months of analyst support
TABLE OF CONTENTS
1 INTRODUCTION
- 1.1 Study Assumptions and Market Definition
- 1.2 Scope of the Study
2 RESEARCH METHODOLOGY
3 EXECUTIVE SUMMARY
4 MARKET LANDSCAPE
- 4.1 Market Overview
- 4.2 Market Drivers
- 4.2.1 Rising defense-modernization budgets among Tier-1 navies
- 4.2.2 Escalating Indo-Pacific maritime tensions
- 4.2.3 Fleet-replacement cycles in legacy nuclear operators
- 4.2.4 Adoption of AIP and Li-ion batteries extending submerged endurance
- 4.2.5 AUKUS pact triggering allied fleet expansion
- 4.2.6 Need to secure subsea data-cable infrastructure
- 4.3 Market Restraints
- 4.3.1 Ultra-high acquisition and lifecycle costs
- 4.3.2 Skilled labor bottlenecks in submarine yards
- 4.3.3 Arms-control and nuclear-proliferation treaties
- 4.3.4 Supply-chain scarcity of marinized semiconductors
- 4.4 Value Chain Analysis
- 4.5 Regulatory Landscape
- 4.6 Technological Outlook
- 4.7 Porter's Five Forces Analysis
- 4.7.1 Bargaining Power of Buyers
- 4.7.2 Bargaining Power of Suppliers
- 4.7.3 Threat of New Entrants
- 4.7.4 Threat of Substitutes
- 4.7.5 Intensity of Competitive Rivalry
5 MARKET SIZE AND GROWTH FORECASTS (VALUE)
- 5.1 By Propulsion Type
- 5.1.1 Nuclear-Powered
- 5.1.2 Diesel-Electric (Conventional and AIP)
- 5.2 By Combat Role
- 5.2.1 Attack (SSN/SSK)
- 5.2.2 Ballistic-Missile (SSBN)
- 5.2.3 Guided-Missile (SSGN)
- 5.3 By Displacement Class
- 5.3.1 Less than 2,000 tons
- 5.3.2 2,000 to 4,000 tons
- 5.3.3 Greater than 4,000 tons
- 5.4 By Component
- 5.4.1 Hull and Structural Modules
- 5.4.2 Propulsion Systems
- 5.4.3 Combat and Sensor Suites
- 5.4.4 Energy Storage (Batteries, AIP)
- 5.5 By Geography
- 5.5.1 North America
- 5.5.1.1 United States
- 5.5.1.2 Canada
- 5.5.2 Europe
- 5.5.2.1 United Kingdom
- 5.5.2.2 France
- 5.5.2.3 Germany
- 5.5.2.4 Rest of Europe
- 5.5.3 South America
- 5.5.3.1 Brazil
- 5.5.3.2 Rest of South America
- 5.5.4 Asia-Pacific
- 5.5.4.1 China
- 5.5.4.2 India
- 5.5.4.3 Japan
- 5.5.4.4 Australia
- 5.5.4.5 Rest of Asia-Pacific
- 5.5.5 Middle East and Africa
- 5.5.5.1 Middle East
- 5.5.5.1.1 Israel
- 5.5.5.1.2 Turkey
- 5.5.5.1.3 Rest of Middle East
- 5.5.5.2 Africa
- 5.5.5.2.1 South Africa
- 5.5.5.2.2 Egypt
- 5.5.5.2.3 Rest of Africa
- 5.5.5.1 Middle East
- 5.5.1 North America
6 COMPETITIVE LANDSCAPE
- 6.1 Strategic Moves
- 6.2 Market Share Analysis
- 6.3 Company Profiles (includes Global level Overview, Market level overview, Core Segments, Financials as available, Strategic Information, Market Rank/Share for key companies, Products and Services, and Recent Developments)
- 6.3.1 General Dynamics Mission Systems, Inc. (General Dynamics Corporation)
- 6.3.2 Huntington Ingalls Industries, Inc.
- 6.3.3 BAE Systems plc
- 6.3.4 Naval Group
- 6.3.5 thyssenkrupp Marine Systems GmbH (thyssenkrupp AG)
- 6.3.6 HD Hyundai Heavy Industries Co. Ltd.
- 6.3.7 Hanwha Corporation
- 6.3.8 Mitsubishi Heavy Industries Ltd.
- 6.3.9 Kawasaki Heavy Industries, Ltd.
- 6.3.10 Saab AB
- 6.3.11 NAVANTIA, S.A., SME
- 6.3.12 Fincantieri S.p.A.
- 6.3.13 United Shipbuilding Corporation
- 6.3.14 China State Shipbuilding Corporation
- 6.3.15 ASC Pty Ltd.
- 6.3.16 PT PAL Indonesia
- 6.3.17 SIMA PERU S.A.
7 MARKET OPPORTUNITIES AND FUTURE OUTLOOK
- 7.1 White-space and Unmet-Need Assessment

