
PUBLISHER: Mordor Intelligence | PRODUCT CODE: 2066465

PUBLISHER: Mordor Intelligence | PRODUCT CODE: 2066465
Nanomaterials - Market Share Analysis, Industry Trends & Statistics, Growth Forecasts (2026 - 2031)
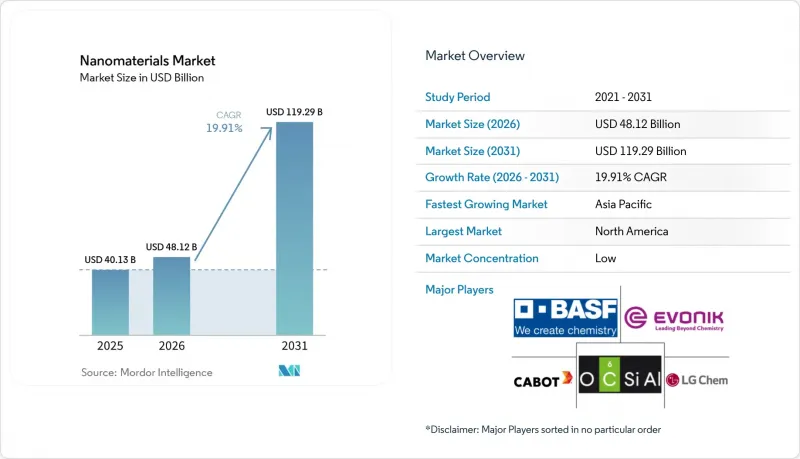
According to Mordor Intelligence, the nanomaterials market size is projected to be USD 40.13 billion in 2025, USD 48.12 billion in 2026, and reach USD 119.29 billion by 2031, growing at a CAGR of 19.91% from 2026 to 2031.
This report is Segmented by Product Type (Nanoparticles, Nanofibers, Nanotubes, Nanoclays, and Nanowires), Structure Type (Non-Polymer Organic and Polymeric), Material Category (Carbon-Based, Metal-Based, Metal-Oxide/Ceramic, and Polymeric/Lipid), End-User Industry (Construction, Electronics, Energy, and More), and Geography (Asia-Pacific, North America, and More). Market Forecasts are Provided in Value (USD).
Global Nanomaterials Market Trends and Insights
Semiconductor Fabs Scaling High-Purity Nano-Slurries
TSMC's Arizona and Samsung's Texas fabs are turning to ceria and alumina CMP slurries, specifically those with sub-50 nm particle sizes, to achieve gate-all-around yield targets. Meanwhile, Intel has greenlit Cabot Microelectronics to provide colloidal-silica formulations, which promise a reduction in defect density compared to benchmarks. The U.S. CHIPS Act, with its domestic-content clauses, is steering procurement towards North American producers, effectively fragmenting the previously Asia-centric supply chain. Vendors lacking inline dynamic-light-scattering controls face disqualification, leading to a concentration of orders with integrated suppliers. As fabs shift towards backside-power delivery, the rising complexity of slurries is driving price premiums for application-engineered grades.
Integration of Nanomaterials in mRNA-Vaccine Platforms
In 2025, Moderna ramped up its processing of ionizable and PEGylated lipids to support flu and combination respiratory vaccines. Meanwhile, BioNTech has integrated continuous-flow microfluidic mixers, enabling real-time adjustments of particle sizes to optimize uptake. Pfizer is testing self-amplifying RNA constructs, which utilize less lipid per dose, translating to a cost reduction per vial. The lipid supply chain is now largely governed by take-or-pay contracts, ensuring guaranteed volumes. However, this arrangement poses a risk for suppliers, as they might face margin compression if prices for cholesterol and DSPC remain high. The silver lining? Established vendors gain multi-year visibility, while newcomers face heightened entry barriers.
Volatile Prices of Critical Nanoscale Feedstocks
In 2025, cyclone damage at Mozambique's Balama mine disrupted the supply of natural-flake graphite, leading to a sharp rise in graphene-oxide spot prices. Simultaneously, costs for titanium tetrachloride surged as Chinese smelters, responding to tightened environmental quotas, curtailed their output. Additionally, export-license restrictions on rare-earth oxides, commonly used in cerium-oxide slurries, resulted in significant price fluctuations. Converters, lacking long-term offtake agreements, find it challenging to safeguard their margins. In a strategic move, BASF acquired a minority stake in a Canadian graphite developer, aiming to secure a steady feedstock. While such forward-integration strategies mitigate exposure to volatile spot markets, they also come with heightened capital demands.
Other drivers and restraints analyzed in the detailed report include:
- Rapid Adoption of Nano-Enabled Water Treatment Systems
- EV Battery Production Using Nano-Structured Electrodes
- High CAPEX for Precision Synthesis Equipment
For complete list of drivers and restraints, kindly check the Table Of Contents.
Segment Analysis
Nanoparticles accounted for 66.78% of 2025 revenue within the nanomaterials market, reflecting entrenched demand for titanium-dioxide sunscreens, silica-reinforced automotive coatings, and alumina fillers. Nanometals such as gold and silver underpin diagnostics that detect biomarkers at picomolar levels. By volume, non-metal oxides lead the market. BASF's Ludwigshafen complex showcased its scale economies by producing fumed silica, primarily for tire reinforcement. Meanwhile, complex oxides, such as lithium titanate, are making strides in solid-state batteries, enabling bus charges in both Shenzhen and Seoul.
Nanotubes are poised for a 21.43% CAGR to 2031 as EV thermal-management systems and 5G antenna arrays embed multi-walled carbon nanotubes for EMI shielding. OCSiAl ramped up its production of single-walled nanotubes, providing battery additives that enhance cycle life. While nanofibers, nanoclays, and nanowires find applications in filtration, packaging, and as transparent conductors, respectively, each remains a niche in terms of value. Compliance with ISO 10808 particle characterization is emerging as a standard entry requirement, giving an edge to vendors equipped with advanced analytics.
Non-polymer organic nanomaterials held 55.12% share in 2025, led by carbon black for low-rolling-resistance tires and carbon-nanotube conductive additives. Aptamers advanced in point-of-care diagnostics, with CE-marked COVID-19 detection kits launched in early 2025. Flagship smartphones now boast small-molecule OLED emitters, harnessing iridium complexes, achieving high quantum efficiencies.
Polymeric grades are set to expand at a 20.05% CAGR, riding demand for nano-silica scratch-resistant coatings and high-efficiency CRISPR-Cas9 transfection reagents. In 2024, diagnostic reagents leveraging quantum dots achieved a milestone, facilitating 12-plex immunoassays from just one serum sample. The pharmaceutical industry has increasingly focused on liposomal and dendrimer drug-delivery vehicles, with Doxil and Abraxane leading the charge. Amidst emerging European biocide proposals, fabric treatments previously reliant on silver nanoparticles are now shifting focus to zinc oxide alternatives. Meanwhile, in the realm of optical and dielectric films, a high-margin niche, securing an ISO 14001 certification has become a strategic procurement advantage.
Geography Analysis
North America contributed 38.78% of 2025 sales, anchored by Arizona's TSMC and Intel fabs that together use nano-slurries annually and by Pfizer-Moderna lipid networks supported by the CHIPS Act and BARDA incentives. Canada's NanoXplore plans to scale graphene output for automotive and construction composites, while Mexico's Monterrey corridor attracts nano-coating lines serving Gigafactory Texas. The U.S. Environmental Protection Agency expects to finalize a nanomaterial reporting rule in mid-2026, mandating disclosure, which may burden smaller producers but increase market transparency.
Asia-Pacific is projected to deliver a 22.32% CAGR, fueled by China's aggressive expansions in graphene and nanotubes. Notably, Jiangsu Cnano is on track to boost its multi-walled nanotube output by 2026. Meanwhile, Japan solidifies its dominance in OLED emitters, thanks to key players like Mitsubishi Chemical and Sumitomo Chemical. South Korea's giants, LG Chem and Samsung SDI, are integrating silicon-nanowire anodes into next-gen batteries. In India, producers of nano-titanium dioxide are ramping up production to cater to the surging demand in paints and sunscreens. ASEAN nations, with Vietnam at the forefront, are piloting graphene-oxide membranes for municipal water, bolstered by foreign direct investment in electronics.
Europe reaps the rewards of stringent REACH pre-registration, a move that benefits established players like BASF, Evonik, and Wacker, who together account for a significant share of the specialty-nanomaterial revenue. In the UK, Versarien and Italy's Directa Plus are scaling up graphene for composite applications. France's Arkema is making strides by commercializing fullerene-based organic photovoltaic materials. South America is still in its nascent stages, with Brazil experimenting with nano-clay cement for the metro expansion in Sao Paulo. The Middle East, spearheaded by Saudi Arabia's Yanbu titanium dioxide complex, is carving out a niche as a cost-effective precursor hub, capitalizing on gas-based titanium tetrachloride production routes.
- ACS Material
- American Elements
- Arkema
- Ascensus
- BASF SE
- Cabot Corporation
- Chasm Advanced Materials, Inc.
- Evonik Industries AG
- Jiangsu Cnano Technology Co., Ltd.
- LG Chem
- Merck KGaA
- Nano-C
- Nanocyl SA
- NAWAH
- OCSiAl
- QuantumSphere, Inc.
- Raymor Industries Inc.
- Resonac Holdings Corporation
- Solesence
- US Research Nanomaterials, Inc.
- Zyvex Technologies
Additional Benefits:
- The market estimate (ME) sheet in Excel format
- 3 months of analyst support
TABLE OF CONTENTS
1 Introduction
- 1.1 Study Assumptions and Market Definition
- 1.2 Scope of the Study
2 Research Methodology
3 Executive Summary
4 Market Landscape
- 4.1 Market Overview
- 4.2 Market Drivers
- 4.2.1 Expansion of semiconductor fabs driving high-purity nano-slurries
- 4.2.2 Rising integration of nanomaterials in mRNA-vaccine platforms
- 4.2.3 Rapid adoption of nano-enabled water treatment systems
- 4.2.4 Surge in EV battery production using nano-structured electrodes
- 4.2.5 EU CBAM incentivising nano-clay low-carbon cement
- 4.3 Market Restraints
- 4.3.1 Volatile prices of critical nanoscale feedstocks
- 4.3.2 High CAPEX for precision synthesis (ALD reactors, etc.)
- 4.3.3 Emerging EHS rules delaying approvals (EU and Canada)
- 4.4 Value Chain Analysis
- 4.5 Porter's Five Forces
- 4.5.1 Bargaining Power of Suppliers
- 4.5.2 Bargaining Power of Buyers
- 4.5.3 Threat of New Entrants
- 4.5.4 Threat of Substitutes
- 4.5.5 Competitive Rivalry
5 Market Size and Growth Forecasts (Value)
- 5.1 By Product Type
- 5.1.1 Nanoparticles
- 5.1.1.1 Nanometals
- 5.1.1.1.1 Gold
- 5.1.1.1.2 Silver
- 5.1.1.1.3 Platinum
- 5.1.1.1.4 Titanium
- 5.1.1.1.5 Aluminium
- 5.1.1.2 Non-metal Oxides
- 5.1.1.2.1 Alumina
- 5.1.1.2.2 Iron Oxide
- 5.1.1.2.3 Titanium Oxide
- 5.1.1.2.4 Silica
- 5.1.1.2.5 Zinc Oxide
- 5.1.1.3 Complex Oxides
- 5.1.1.3.1 Calcium Phosphate
- 5.1.1.3.2 Rare-earth Metal Oxides
- 5.1.1.3.3 Lithium Titanate
- 5.1.1.3.4 Silica Hydride
- 5.1.1.1 Nanometals
- 5.1.2 Nanofibers
- 5.1.3 Nanotubes
- 5.1.4 Nanoclays
- 5.1.5 Nanowires
- 5.1.1 Nanoparticles
- 5.2 By Structure Type
- 5.2.1 Non-polymer Organic Nanomaterials
- 5.2.1.1 Carbon Black
- 5.2.1.2 Carbon Nanotubes
- 5.2.1.3 Aptamers
- 5.2.1.4 Small-molecule OLED Materials
- 5.2.1.5 Activated Carbon
- 5.2.1.6 Carbon Nanotube Composites
- 5.2.2 Polymeric Nanomaterials
- 5.2.2.1 Coatings and Adhesives
- 5.2.2.2 Transfection Reagents
- 5.2.2.3 Diagnostic Reagents
- 5.2.2.4 Drug-delivery Vehicles
- 5.2.2.5 Fabric Treatments
- 5.2.2.6 Optical Coatings
- 5.2.2.7 Nano-porous Filtration Membranes
- 5.2.2.8 Dielectric Films
- 5.2.2.9 OLED Films
- 5.2.1 Non-polymer Organic Nanomaterials
- 5.3 By Material Category
- 5.3.1 Carbon-based
- 5.3.2 Metal-based
- 5.3.3 Metal-oxide and Ceramic-based
- 5.3.4 Polymeric and Lipid-based
- 5.4 By End-user Industry
- 5.4.1 Construction
- 5.4.2 Electronics
- 5.4.3 Energy
- 5.4.4 Healthcare
- 5.4.5 Personal Care
- 5.4.6 Rubber
- 5.4.7 Other End-user Industries
- 5.5 By Geography
- 5.5.1 Asia-Pacific
- 5.5.1.1 China
- 5.5.1.2 India
- 5.5.1.3 Japan
- 5.5.1.4 South Korea
- 5.5.1.5 ASEAN
- 5.5.1.6 Rest of Asia-Pacific
- 5.5.2 North America
- 5.5.2.1 United States
- 5.5.2.2 Canada
- 5.5.2.3 Mexico
- 5.5.3 Europe
- 5.5.3.1 Germany
- 5.5.3.2 United Kingdom
- 5.5.3.3 Italy
- 5.5.3.4 France
- 5.5.3.5 Rest of Europe
- 5.5.4 South America
- 5.5.4.1 Brazil
- 5.5.4.2 Argentina
- 5.5.4.3 Rest of South America
- 5.5.5 Middle-East and Africa
- 5.5.5.1 Saudi Arabia
- 5.5.5.2 South Africa
- 5.5.5.3 Rest of Middle-East and Africa
- 5.5.1 Asia-Pacific
6 Competitive Landscape
- 6.1 Market Concentration
- 6.2 Strategic Moves
- 6.3 Market Share/Ranking Analysis
- 6.4 Company Profiles (includes Global Overview, Market-level Overview, Core Segments, Financials, Strategic Information, Products and Services, and Recent Developments)
- 6.4.1 ACS Material
- 6.4.2 American Elements
- 6.4.3 Arkema
- 6.4.4 Ascensus
- 6.4.5 BASF SE
- 6.4.6 Cabot Corporation
- 6.4.7 Chasm Advanced Materials, Inc.
- 6.4.8 Evonik Industries AG
- 6.4.9 Jiangsu Cnano Technology Co., Ltd.
- 6.4.10 LG Chem
- 6.4.11 Merck KGaA
- 6.4.12 Nano-C
- 6.4.13 Nanocyl SA
- 6.4.14 NAWAH
- 6.4.15 OCSiAl
- 6.4.16 QuantumSphere, Inc.
- 6.4.17 Raymor Industries Inc.
- 6.4.18 Resonac Holdings Corporation
- 6.4.19 Solesence
- 6.4.20 US Research Nanomaterials, Inc.
- 6.4.21 Zyvex Technologies
7 Market Opportunities and Future Outlook
- 7.1 White-space and Unmet-need Assessment

