
PUBLISHER: Mordor Intelligence | PRODUCT CODE: 2066475

PUBLISHER: Mordor Intelligence | PRODUCT CODE: 2066475
Syngas - Market Share Analysis, Industry Trends & Statistics, Growth Forecasts (2026 - 2031)
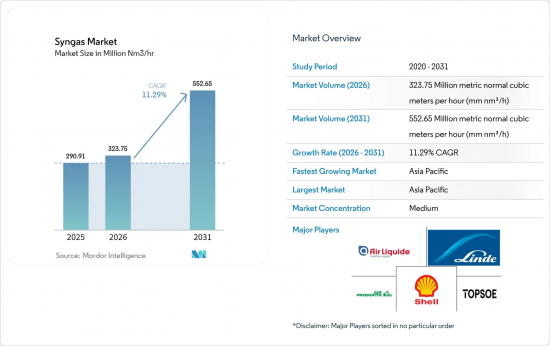
According to Mordor Intelligence, the syngas market size is expected to grow from 290.91 Million metric normal cubic meters per hour (mm nm3/h) in 2025 to 323.75 Million metric normal cubic meters per hour (mm nm3/h) in 2026 and is forecast to reach 552.65 Million metric normal cubic meters per hour (mm nm3/h) by 2031 at 11.29% CAGR over 2026-2031.
This report is Segmented by Feedstock (Coal, Natural Gas, and More), Technology (Steam Reforming and Gasification), Gasifier Type (Fixed Bed, Fluidized Bed, and Entrained Flow), Application (Methanol, Ammonia, and More), and Geography (Asia-Pacific, North America, Europe, South America, and Middle-East and Africa). The Market Forecasts are Provided in Terms of Volume (Units).
Global Syngas Market Trends and Insights
Surging Demand for Methanol-To-Olefins (MTO) Complexes in China
China's petrochemical industry is shifting from gasoline centric refining to higher-value chemical production. Completion of Ningxia Coal Industry's 3.6 million tons per annum DMTO-III plant, a CNY 11.8 billion investment, demonstrates confidence in the MTO route. The project saves raw coal and natural gas while cutting CO2 emissions, underscoring a broader national pivot toward monetizing coal via chemicals rather than fuels. MTO capacity requires about 2.8 tons of syngas to yield 1 ton of ethylene equivalent, so syngas becomes the limiting reagent for incremental olefins output. Advanced catalytic pyrolysis from SINOPEC boosts light-olefin yields and further lowers emissions. As integrated crude-to-chemical complexes mature, they unlock flexibility that buffers margins during demand swings, creating enduring syngas market growth.
Fertilizer Capacity Additions in South Asia and Africa
Food security priorities and population expansion drive large ammonia projects that intensify syngas demand. AM Green Ammonia reached a final investment decision on a 1 million ton green plant in Kakinada and targets 5 million tons per year by 2030. The project has pre-certification under EU RFNBO rules, signaling strategic intent to capture premium European offtake. Global ammonia consumption is forecast to rise from 201 million tons in 2024 to 310 million tons by 2040, with the bulk still routed to urea fertilizers. Perdaman selected Topsoe's SynCOR for a 3,500 metric tons per day plant, achieving economies of scale that slash unit costs and raise syngas utilization efficiency. Such gigascale designs concentrate syngas requirements in fewer hubs, heightening regional demand spikes and stimulating supporting infrastructure.
US-EU Restrictions on Russian Gasification Equipment
Sanctions have tightened export licensing for oil and gas equipment to Russia, covering gasifiers and ancillary systems critical for syngas production. The US Commerce Department applies a presumption of denial for most applications, while the EU's 14th package bars investment in Russian LNG projects under construction. More than 180 vessels face prohibition due to illicit shipping practices that include syngas technology deliveries. European developers now navigate longer procurement cycles and premium pricing to source non-Russian equipment, delaying commissioning schedules. Financing institutions incorporate these geopolitical risks into credit terms, raising debt costs for projects exposed to restricted suppliers. As a result, the syngas market faces near-term setbacks until alternative supply chains stabilize.
Other drivers and restraints analyzed in the detailed report include:
- Stringent Emission Norms Driving Coal-To-Gas Projects
- Carbon-Neutral Aviation Fuel Mandates (Power-To-Liquids)
- Volatility in Coal and Natural-Gas Feedstock Pricing
For complete list of drivers and restraints, kindly check the Table Of Contents.
Segment Analysis
Natural gas generated 69.10% of syngas market share in 2025, reflecting widespread steam reforming infrastructure and competitively priced supply. The segment is forecast to post a 16.38% CAGR through 2031, the highest among all feedstocks, driven by blue hydrogen investments that embed carbon capture into existing facilities. Operators such as ExxonMobil plan to remove 98% of CO2 from reforming streams at the Baytown complex, underscoring decarbonization potential. Integration with sequestration hubs and hydrogen pipelines lowers incremental logistics cost and sustains growth momentum. The syngas market size for natural gas feedstock is projected to expand quickly as petrochemical producers shift toward lower-carbon molecules.
Coal remains structurally important, especially in China where domestic reserves offer energy security and cost certainty. Regulatory mandates compel higher cold-gas efficiencies and carbon capture, which raises capital expenditure but improves environmental performance. Petroleum coke gasification addresses refinery waste valorization, allowing operators to monetize high-sulfur streams and reduce disposal liabilities. Renewable feedstocks, led by municipal solid waste and agricultural residues, currently represent a small portion but earn credits under low-carbon fuel standards. As technology matures, expectations of a broader feedstock mix keep long-term investors engaged in the syngas market.
Gasification technologies delivered 54.40% of 2025 revenue, yet steam reforming is expected to expand at a 12.71% CAGR through 2031, reflecting its adaptability to blue hydrogen pathways. Steam reformers achieve thermal efficiencies above 80% when complemented by waste-heat recovery, and carbon capture insertion lowers lifecycle emissions enough to earn premium offtake contracts. Air Liquide's renewable hydrogen projects demonstrate how recycled biogenic by-products can replace fossil hydrocarbons in reformer feedstocks, cutting emission intensity without major hardware changes. Innovations in autothermal reforming further reduce oxygen demand, thereby lowering utility cost and capital expenditure.
Gasification retains an edge in feedstock flexibility, processing coal, petcoke, and biomass within the same reactor family. Entrained flow and fluidized bed gasifiers optimize for higher throughput or feedstock variability, respectively. NETL's catalytic steam gasification eliminates nitrogen dilution by operating with steam alone, boosting product purity for ammonia or Fischer-Tropsch synthesis. Hybrid approaches such as Linde's Hot Oxygen Technology combine reforming and gasification, converting residual tars into additional syngas and lifting overall yield. These continuous improvements keep gasification competitive even as steam reforming gains low-carbon momentum, ensuring diverse technology adoption within the syngas market.
Geography Analysis
Asia-Pacific commanded 59.02% of 2025 demand and is forecast to register a 13.57% CAGR through 2031, the highest among regions. China's massive coal chemical base expands further with Ningxia Coal Industry's CNY 11.8 billion DMTO-III installation, ensuring a vast pull on upstream syngas. India's National Green Hydrogen Mission supports projects like AM Green Ammonia, aiming for 5 million tons of export-oriented capacity by 2030. Southeast Asian countries add distributed gasifiers to convert agricultural residues into power and fertiliser intermediates, thereby reducing import bills. These activities anchor the syngas market in the region and foster specialized engineering hubs.
North America leverages low-cost shale gas and generous carbon capture incentives. Air Products' USD 4.5 billion Louisiana complex will deliver 750 million scf/d of blue hydrogen and sequester 5 million tons of CO2 annually, integrating with 700 miles of pipeline. Linde's Path2Zero facility in Alberta invests more than USD 2 billion to combine autothermal reforming with CCS, strengthening continental supply resilience. Canadian provinces position themselves as export gateways for ammonium and methanol to Asia, further embedding the syngas market in trans-Pacific trade.
Europe pushes renewable pathways. Air Liquide and its partners are developing 450 MW of electrolyzers in Rotterdam and Zeeland, collectively producing 53,000 tons of green hydrogen each year. Statutory obligations on SAF create guaranteed offtake for power-to-liquid plants in Germany and the Netherlands, raising capital confidence. Middle-East and Africa benefit from abundant natural gas and established petrochemical ports, with Aramco's expansion adding 3.15 billion scf/d by 2028. South American potential emerges through Chile's Volta USD 2.5 billion green ammonia venture. The geographic spread underscores how the syngas market thrives in diverse policy and resource settings.
List of Companies Covered in this Report:
- AHT Syngas Technology N.V.
- Air Liquide
- Air Products and Chemicals, Inc.
- BASF SE
- John Wood Group PLC
- KBR Inc.
- Linde plc
- MAIRE S.p.A.
- POSCO
- Sasol
- Shell plc
- Technip Energies N.V.
- Thyssenkrupp
- Topsoe A/S
Additional Benefits:
- The market estimate (ME) sheet in Excel format
- 3 months of analyst support
TABLE OF CONTENTS
1 Introduction
- 1.1 Study Assumptions and Market Definition
- 1.2 Scope of the Study
2 Research Methodology
3 Executive Summary
4 Market Landscape
- 4.1 Market Overview
- 4.2 Market Drivers
- 4.2.1 Surging Demand for Methanol-To-Olefins (MTO) Complexes in China
- 4.2.2 Fertilizer Capacity Additions in South Asia and Africa
- 4.2.3 Stringent Emission Norms Driving Coal-To-Gas (CTG) Projects
- 4.2.4 Carbon-Neutral Aviation Fuel Mandates (Power-To-Liquids)
- 4.2.5 Municipal-Solid-Waste Gasification for Grid-Scale Hydrogen
- 4.3 Market Restraints
- 4.3.1 US-EU Restrictions on Russian Gasification Equipment
- 4.3.2 Volatility in Coal and Natural-Gas Feedstock Pricing
- 4.3.3 Limited Bankability of Biomass Gasification Projects
- 4.4 Value Chain Analysis
- 4.5 Porter's Five Forces
- 4.5.1 Bargaining Power of Suppliers
- 4.5.2 Bargaining Power of Buyers
- 4.5.3 Threat of New Entrants
- 4.5.4 Threat of Substitutes
- 4.5.5 Degree of Competition
5 Market Size and Growth Forecasts (Volume)
- 5.1 By Feedstock
- 5.1.1 Coal
- 5.1.2 Natural Gas
- 5.1.3 Petroleum Coke
- 5.1.4 Other Feedstock Types
- 5.2 By Technology
- 5.2.1 Steam Reforming
- 5.2.2 Gasification
- 5.3 By Gasifier Type
- 5.3.1 Fixed Bed
- 5.3.2 Fluidized Bed
- 5.3.3 Entrained Flow
- 5.4 By Application
- 5.4.1 Methanol
- 5.4.2 Ammonia
- 5.4.3 Hydrogen
- 5.4.4 Liquid Fuels
- 5.4.5 Synthetic Natural Gas
- 5.4.6 Direct Reduced Iron
- 5.4.7 Electricity
- 5.4.8 Others Applications
- 5.5 By Geography
- 5.5.1 Asia-Pacific
- 5.5.1.1 China
- 5.5.1.2 India
- 5.5.1.3 Rest of Asia-Pacific
- 5.5.2 North America
- 5.5.2.1 United States
- 5.5.2.2 Canada
- 5.5.2.3 Trinidad and Tobago
- 5.5.3 Europe
- 5.5.3.1 Russia
- 5.5.3.2 Rest of Europe
- 5.5.4 South America
- 5.5.4.1 Brazil
- 5.5.4.2 Venezuela
- 5.5.4.3 Rest of South America
- 5.5.5 Middle-East and Africa
- 5.5.5.1 Saudi Arabia
- 5.5.5.2 Qatar
- 5.5.5.3 South Africa
- 5.5.5.4 Iran
- 5.5.5.5 Rest of Middle-East and Africa
- 5.5.1 Asia-Pacific
6 Competitive Landscape
- 6.1 Market Concentration
- 6.2 Strategic Moves
- 6.3 Market Share(%)/Ranking Analysis
- 6.4 Company Profiles (includes Global level Overview, Market level overview, Core Segments, Financials as available, Strategic Information, Market Rank/Share for key companies, Products and Services, and Recent Developments)
- 6.4.1 AHT Syngas Technology N.V.
- 6.4.2 Air Liquide
- 6.4.3 Air Products and Chemicals, Inc.
- 6.4.4 BASF SE
- 6.4.5 John Wood Group PLC
- 6.4.6 KBR Inc.
- 6.4.7 Linde plc
- 6.4.8 MAIRE S.p.A.
- 6.4.9 POSCO
- 6.4.10 Sasol
- 6.4.11 Shell plc
- 6.4.12 Technip Energies N.V.
- 6.4.13 Thyssenkrupp
- 6.4.14 Topsoe A/S
7 Market Opportunities and Future Outlook
- 7.1 White-space and Unmet-Need Assessment

