PUBLISHER: Mordor Intelligence | PRODUCT CODE: 2066525

PUBLISHER: Mordor Intelligence | PRODUCT CODE: 2066525
Butane - Market Share Analysis, Industry Trends & Statistics, Growth Forecasts (2026 - 2031)
According to Mordor Intelligence, the butane market size is projected to expand from 196.84 Million tons in 2025 and 205.32 Million tons in 2026 to 253.55 Million tons by 2031, registering a CAGR of 4.31% between 2026 to 2031.
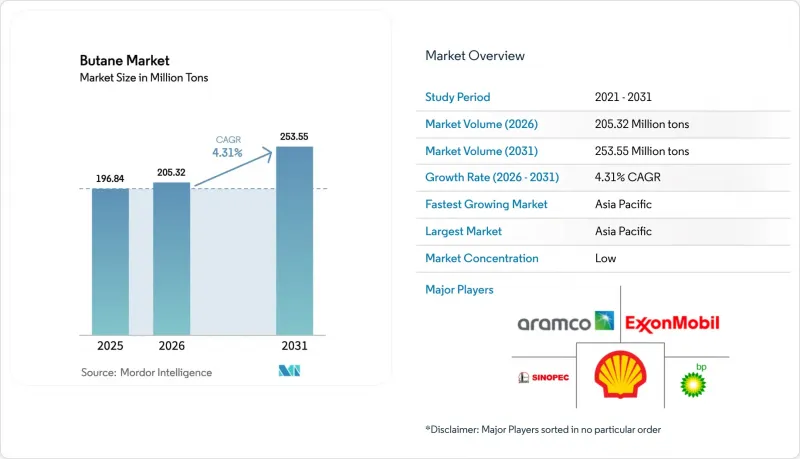
This report is Segmented by Product Type (n-Butane and Iso-Butane), Source (Natural Gas and Refining), End-User Industry (Residential/Commercial, Industrial, Engine Fuel, Refinery, and Other End-User Industries), and Geography (Asia-Pacific, North America, Europe, South America, and Middle-East and Africa). The Market Forecasts are Provided in Terms of Volume (Tons).
Global Butane Market Trends and Insights
Surging LPG Uptake for Clean Cooking and Heating
LPG outpaced electric and biogas alternatives between 2020 and 2025 by covering 75% of new clean-cooking access in sub-Saharan Africa. Government programs such as India's Pradhan Mantri Ujjwala Yojana issued more than 100 million LPG connections by 2024, embedding butane-propane blends into previously biomass-dependent households. International forecasts indicate residential LPG demand could reach 3.4 million barrels per day by 2040 under accelerated-access scenarios. However, refill rates remain under four cylinders per household each year in many rural districts, underscoring the importance of solving high last-mile distribution costs that at times exceed the fuel's own value. These mixed signals suggest that continued policy support and infrastructure build-out are essential to converting initial access into sustained volume growth for the butane market.
Expanding Petrochemical Demand (C4 Cracking, Alkylates)
Global petrochemical feedstock use of LPG and naphtha rose from 14 million barrels per day in 2023 to an estimated 15.2 million barrels per day in 2025. n-Butane acts as a swing feedstock for steam crackers when naphtha prices jump, while iso-butane feeds alkylation units that secure high-octane gasoline blendstocks. Tightening balances have emerged as Chinese propane dehydrogenation projects slowed, lifting regional butane premiums. European players followed suit, with Borealis commissioning a 30,000-barrel-per-day LPG-based dehydrogenation unit in Belgium in 2024, an example of hedging against naphtha volatility. The collective outcome is a more durable demand base that decouples petrochemical margins from crude-oil price swings, cementing a long-run uplift for the butane market.
Crude-Oil and NGL Price Volatility
Butane prices mirror crude benchmarks with a 0.7 to 0.9 correlation, meaning a USD 10 swing in Brent moves butane by USD 7 to USD 9. Intra-year quotes at Mont Belvieu ranged from USD 28 to USD 52 per barrel during 2024, forcing petrochemical buyers to hold 30-to-45-day inventories that raised working capital needs by up to 25%. Such turbulence limits appetite for long-term contracts, encouraging users to diversify toward naphtha or propane when butane premiums spike, marginally trimming growth prospects for the butane market.
Other drivers and restraints analyzed in the detailed report include:
- Autogas Adoption in Emission-Constrained Fleets
- U.S. Export Surge Reshaping Global Price Benchmarks
- Electrification and Alternative Fuels Substitution
For complete list of drivers and restraints, kindly check the Table Of Contents.
Segment Analysis
n-Butane captured 56.23% of the 2025 volume, reflecting its dual role in residential LPG blends and as a steam-cracker feedstock for C4 olefins. The segment is forecast to grow at a 4.97% CAGR through 2031, reinforcing its position in the butane market. Iso-butane expands slowly due to limited new refinery alkylation projects and growing electric-vehicle penetration that erodes gasoline octane demand. The n-butane advantage is amplified when naphtha trades above USD 600 per ton, a threshold breached in 11 of the past 24 months, prompting Asian crackers to switch feedstock and pushing n-butane utilization rates to record levels.
n-Butane also benefits from niche uses in aerosol propellants and lighter fluids, adding around 2 million tons of stable annual demand that cushions the segment from petrochemical cyclicality. Meanwhile, iso-butane margins face pressure as U.S. refiners channel capital toward renewable diesel units that require less alkylate blendstock. The resulting product-type divergence shapes trade flows: Middle Eastern suppliers rich in iso-butane must price cargoes competitively against U.S. n-butane, whereas integrated players with flexible fractionation can tailor output to regional demand patterns, securing higher realizations and strengthening their footing in the butane market.
Geography Analysis
Asia-Pacific anchored 54.26% of global demand in 2025 and is on track to expand at 5.33% CAGR through 2031, driven by China's petrochemical expansion and India's continuing LPG-cylinder rollout. China imported 12 million tons in 2025, up 6% year on year, locking into multiyear contracts with U.S. and Middle Eastern suppliers to secure feedstock for propylene and butadiene output. India held 340 million active cylinder connections in 2025, yet rural refill rates remain low, reminding suppliers that infrastructure access alone does not guarantee consumption growth.
North America held a significant market share in 2025, and supplied roughly 60% of seaborne butane, supported by Enterprise Products Partners' 400,000-barrel-per-day fractionation expansion at Mont Belvieu, completed in 2024. Regional consumption grows at a milder rate as residential saturation offsets petrochemical uptake. Europe faces a flat outlook, with electrification of home heating and stringent fuel-efficiency rules capping autogas upside. However, select clusters such as Spain and Poland still pursue autogas as a compliance tool, tempering the overall slowdown.
The Middle East and Africa display divergent trajectories. Saudi Arabia's petrochemical integration absorbs incremental domestic NGL output, limiting export availability yet deepening local offtake. Conversely, sub-Saharan Africa's policy push for clean cooking creates a sizable back-of-the-queue demand pool, though logistical costs and currency volatility remain hurdles. South American butane demand is led by Brazil's autogas program that could lift regional consumption by 50,000 barrels per day by 2027. These regional snapshots confirm that freight economics and terminal capacity often dictate trade flows more than headline consumption figures in the butane market.
- Bharat Petroleum Corporation Limited
- BP plc
- Chevron Phillips Chemical Company LLC
- China Petrochemical Corporation
- ConocoPhillips
- Dow
- Equinor ASA
- Exxon Mobil Corporation
- Gazprom
- Linde PLC
- Petroliam Nasional Berhad (PETRONAS)
- Petron Corporation
- Reliance Industries Limited
- Saudi Arabian Oil Co.
- Shell
- TotalEnergies
- Valero Energy Corporation
Additional Benefits:
- The market estimate (ME) sheet in Excel format
- 3 months of analyst support
TABLE OF CONTENTS
1 Introduction
- 1.1 Study Assumptions and Market Definition
- 1.2 Scope of the Study
2 Research Methodology
3 Executive Summary
4 Market Landscape
- 4.1 Market Overview
- 4.2 Market Drivers
- 4.2.1 Surging LPG uptake for clean cooking and heating
- 4.2.2 Expanding petrochemical demand (C4 cracking, alkylates)
- 4.2.3 Autogas adoption in emission-constrained fleets
- 4.2.4 U.S. export surge reshaping global price benchmarks
- 4.2.5 Digital-twin optimisation of LPG storage logistics
- 4.3 Market Restraints
- 4.3.1 Crude-oil and NGL price volatility
- 4.3.2 Electrification and alternative fuels substitution
- 4.3.3 Chokepoint shipping disruptions (Red Sea, Panama)
- 4.4 Value Chain Analysis
- 4.5 Porter's Five Forces
- 4.5.1 Bargaining Power of Suppliers
- 4.5.2 Bargaining Power of Buyers
- 4.5.3 Threat of New Entrants
- 4.5.4 Threat of Substitutes
- 4.5.5 Degree of Competition
5 Market Size and Growth Forecasts (Volume)
- 5.1 By Product Type
- 5.1.1 n-Butane
- 5.1.2 Iso-butane
- 5.2 By Source
- 5.2.1 Natural Gas
- 5.2.2 Refining
- 5.3 By End-user Industry
- 5.3.1 Residential/Commercial
- 5.3.2 Industrial (Including Chemical Feedstock)
- 5.3.3 Engine Fuel
- 5.3.4 Refinery
- 5.3.5 Other End-user Industries
- 5.4 By Geography
- 5.4.1 Asia-Pacific
- 5.4.1.1 China
- 5.4.1.2 India
- 5.4.1.3 Japan
- 5.4.1.4 South Korea
- 5.4.1.5 Rest of Asia-Pacific
- 5.4.2 North America
- 5.4.2.1 United States
- 5.4.2.2 Canada
- 5.4.2.3 Mexico
- 5.4.3 Europe
- 5.4.3.1 Germany
- 5.4.3.2 United Kingdom
- 5.4.3.3 France
- 5.4.3.4 Italy
- 5.4.3.5 Rest of Europe
- 5.4.4 South America
- 5.4.4.1 Brazil
- 5.4.4.2 Argentina
- 5.4.4.3 Rest of South America
- 5.4.5 Middle-East and Africa
- 5.4.5.1 Saudi Arabia
- 5.4.5.2 South Africa
- 5.4.5.3 Rest of Middle-East and Africa
- 5.4.1 Asia-Pacific
6 Competitive Landscape
- 6.1 Market Concentration
- 6.2 Strategic Moves
- 6.3 Market Share(%)/Ranking Analysis
- 6.4 Company Profiles (includes Global level Overview, Market level overview, Core Segments, Financials as available, Strategic Information, Products and Services, and Recent Developments)
- 6.4.1 Bharat Petroleum Corporation Limited
- 6.4.2 BP plc
- 6.4.3 Chevron Phillips Chemical Company LLC
- 6.4.4 China Petrochemical Corporation
- 6.4.5 ConocoPhillips
- 6.4.6 Dow
- 6.4.7 Equinor ASA
- 6.4.8 Exxon Mobil Corporation
- 6.4.9 Gazprom
- 6.4.10 Linde PLC
- 6.4.11 Petroliam Nasional Berhad (PETRONAS)
- 6.4.12 Petron Corporation
- 6.4.13 Reliance Industries Limited
- 6.4.14 Saudi Arabian Oil Co.
- 6.4.15 Shell
- 6.4.16 TotalEnergies
- 6.4.17 Valero Energy Corporation
7 Market Opportunities and Future Outlook
- 7.1 White-space and Unmet-need Assessment

