
PUBLISHER: Mordor Intelligence | PRODUCT CODE: 2066537

PUBLISHER: Mordor Intelligence | PRODUCT CODE: 2066537
MEMS Energy Harvesting Devices - Market Share Analysis, Industry Trends & Statistics, Growth Forecasts (2026 - 2031)
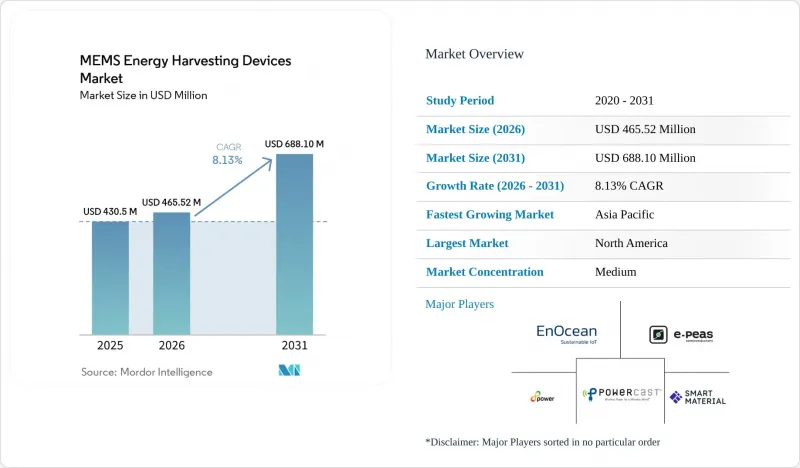
According to Mordor Intelligence, the mEMS energy harvesting devices market size is expected to grow from USD 430.50 million in 2025 to USD 465.52 million in 2026 and is forecast to reach USD 688.10 million by 2031 at 8.13% CAGR over 2026-2031.
This report is Segmented by Technology (Solar (Photovoltaic) Energy Harvesting, Thermal Energy Harvesting, and More), Deployment Type (Wired Systems, and Wireless Systems), Powering Range (Low-Power Devices, and Medium-To-High Power Devices), End-User Industry (Building and Home Automation, Consumer Electronics, and More), and Geography. The Market Forecasts are Provided in Terms of Value (USD).
Global MEMS Energy Harvesting Devices Market Trends and Insights
Rising Adoption of Battery-Free Wireless Sensor Networks
The MEMS energy harvesting devices market has been pushed most directly by the wider rollout of battery-free wireless sensor networks. Battery replacement at scale remains a hidden operating burden because even modest industrial sites spend large amounts of staff time servicing sensor nodes that are wireless in communication but still dependent on stored chemical energy. Ambient IoT architectures address this issue by pairing energy harvesting with low-duty-cycle communication so nodes can transmit without carrying a conventional battery. A 2026 study showed that energy-harvesting wireless sensor nodes using adaptive data allocation transmitted a 128-bit packet with 12 µJ of energy, which was 88% lower than continuously active nodes. Standardization work around ambient power communication in IEEE 802.11 TGbp is creating clearer certification pathways for battery-free endpoints, which supports broader ecosystem formation for the MEMS energy harvesting devices market. That shift matters because the MEMS energy harvesting devices market now has a clearer route from limited pilots to repeatable fleet deployments in buildings, factories, and infrastructure.
Growth in Industrial Condition Monitoring and Predictive Maintenance
The MEMS energy harvesting devices market is being pushed most directly by the wider rollout of battery-free wireless sensor networks. Battery replacement at scale remains a hidden operating burden because even modest industrial sites spend large amounts of staff time servicing sensor nodes that are wireless in communication but still dependent on stored chemical energy. Ambient IoT architectures address this issue by pairing energy harvesting with low-duty-cycle communication so nodes can transmit without carrying a conventional battery. A 2026 study in Sensors shows that energy-harvesting wireless sensor nodes using adaptive data allocation transmit a 128-bit packet with 12 µJ of energy use, which is 88% lower than continuously active nodes. Standardization work around ambient power communication in IEEE 802.11 TGbp is creating clearer certification pathways for battery-free endpoints, which supports broader ecosystem formation for the MEMS energy harvesting devices market. That shift matters because the MEMS energy harvesting devices market now has a clearer route from limited pilots to repeatable fleet deployments in buildings, factories, and infrastructure.
Limited Power Output and Dependence on Intermittent Ambient Energy
Limited power output remains the most binding restraint on the MEMS energy harvesting devices market. Typical ambient harvesters in industrial settings generate tens to hundreds of microwatts, which supports periodic low-data-rate transmission but not sustained compute-heavy operation. The problem becomes harder when ambient energy disappears, because indoor light drops at night, thermal gradients collapse when equipment stops, and vibration harvesting pauses during machine downtime. Designers can respond with hybrid harvesting or larger storage buffers, but both options add cost, system volume, and design complexity. That makes full battery elimination difficult in applications that require reliable performance across variable operating conditions. Until energy availability can be predicted and buffered with greater consistency, the MEMS energy harvesting devices market will remain strongest in low-duty-cycle use cases rather than continuous high-load operation.
Other drivers and restraints analyzed in the detailed report include:
- Expansion of Smart Buildings and Retrofit Building Controls
- Advances In Ultra-Low-Power PMICs and Wireless SoCs
- Narrow Bandwidth and Resonance Mismatch in Piezoelectric MEMS Designs
For complete list of drivers and restraints, kindly check the Table Of Contents.
Segment Analysis
Vibration and piezoelectric energy harvesting held 44.23% of the MEMS energy harvesting devices market size in 2025, making it the largest technology segment. This lead arose from the large installed base of machines that generate usable mechanical energy and from the strong fit between piezoelectric conversion and rotating asset monitoring. A 2025 study in "Smart Materials and Structures" showed that variable-section multimodal piezoelectric harvesters improved broadband capture through structural optimization, directly addressing real deployment limits caused by resonance mismatch. Solar harvesting remained the main secondary technology path, and Dracula Technologies stated in January 2026 that its LAYER V2.0 organic photovoltaic platform delivered a 30% performance increase over the prior generation for indoor applications.
Thermal harvesting served a smaller but strategically important niche where stable temperature differentials existed around heat-intensive equipment. RF energy harvesting is the fastest-growing technology segment in the MEMS energy harvesting devices market and is projected to expand at 8.78% through 2031 as ambient IoT tags draw power from existing wireless infrastructure. Wiliot stated in January 2026 that its Gen3 IoT Pixel uses a dual-band architecture across 2.4 GHz and sub-1 GHz to improve harvesting efficiency and energizing range over the prior generation. A 2026 "Micromachines" paper also demonstrated an RF energy-harvesting IoT network architecture using a BQ25504-based power path, while IEEE 802.11 TGbp continues to build a certified ambient power communications framework.
Wireless systems held 72.45% of the deployment type segment in 2025 and are also the fastest-growing category at 9.23% through 2031. That lead shows that removing battery maintenance is most valuable when the same design also removes power and data cabling. In the MEMS energy harvesting devices market, this makes wireless deployment the practical default for large sensor fleets in buildings and distributed industrial settings. Atmosic states that its platform supports ultra-low-power connectivity with integrated energy harvesting and IEEE 802.15.4 capability, which reduces integration burden for system developers.
Wired systems kept a meaningful role where latency, bandwidth, or electromagnetic interference limits made wireless less suitable. Some industrial environments still separate power and communication functions, using harvested energy at the sensor while keeping a wired data path for reliability. This portion of the MEMS energy harvesting devices market remains stable because the application requirements are specific rather than broad. The result is a two-speed structure where wireless captures most new installations while wired designs remain in a narrower set of performance-sensitive deployments.
Geography Analysis
North America retained 32.78% of the MEMS energy harvesting devices market share in 2025, which kept it in the leading regional position. The United States remained the main revenue center because industrial condition monitoring, smart building retrofits, and data center sensing all reached earlier commercial maturity than in many other regions. EnOcean stated in 2025 that its energy-harvesting solutions achieved listing on the DesignLights Consortium Qualified Products List, which opened a pathway for utility rebate access in the United States. Canada and Mexico stayed smaller within the region, but both supported demand through mining, oil and gas, and manufacturing use cases that align well with vibration-based sensing. For the MEMS energy harvesting devices market, this regional lead rested on both installed digital infrastructure and a regulatory setting that rewarded efficient wireless building controls.
Europe remained a substantial regional market led by Germany, the United Kingdom, France, Italy, and Spain. Demand in Europe is closely tied to energy efficiency and industrial compliance rules, which favor low-maintenance sensor deployments in both buildings and process environments. The European Commission adopted Directive (EU) 2025/2363 in November 2025 and created exemption 7(c)-VI for lead in piezoelectric PZT ceramics until December 31, 2027, which gave suppliers a defined planning window while pushing lead-free substitution work. Sweden also emerged as a notable photovoltaic harvesting center after the Swedish Energy Agency awarded Exeger SEK 130 million, or USD 12.2 million, in 2025 to scale indoor solar cell technology. South America and Middle East, and Africa remained smaller, but mining sites and smart city programs created targeted openings for maintenance-free sensing.
Asia-Pacific is the fastest-growing region in the MEMS energy harvesting devices market and is forecast to expand at 8.94% through 2031. China's large IoT infrastructure buildout, Japan's strength in piezoelectric materials, South Korea's PMIC ecosystem, and India's rising building and manufacturing digitalization are supporting this growth pattern. A 2026 study indexed by CiNii Research described wireless power transfer for building management sensor modules through glass surfaces, which fits Japan's preference for low-disruption retrofit design. ASEAN countries such as Singapore, Malaysia, and Thailand are also moving from pilots toward production-scale ambient IoT sensing in logistics and manufacturing settings.
- EnOcean GmbH
- e-peas S.A.
- 8power Limited
- Powercast Corporation
- Smart Material Corporation
- EH4 GmbH
- Smart Material GmbH
- ReVibe Energy AB
- MEMSYS B.V.
- Enervibe Ltd.
- Pyro-E, Inc.
- WePower Technologies LLC
- Everactive, Inc.
- Atmosic, Inc.
- Wiliot Ltd.
- Dracula Technologies SAS
- Exeger Sweden AB (publ)
- EPISHINE AB
- Cymbet Corporation
- MicroGen Systems, Inc.
Additional Benefits:
- The market estimate (ME) sheet in Excel format
- 3 months of analyst support
TABLE OF CONTENTS
1 INTRODUCTION
- 1.1 Study Assumptions and Market Definition
- 1.2 Scope of the Study
2 RESEARCH METHODOLOGY
3 EXECUTIVE SUMMARY
4 MARKET LANDSCAPE
- 4.1 Market Overview
- 4.2 Market Drivers
- 4.2.1 Rising Adoption of Battery-Free Wireless Sensor Networks
- 4.2.2 Expansion of Smart Buildings and Retrofit Building Controls
- 4.2.3 Growth in Industrial Condition Monitoring and Predictive Maintenance
- 4.2.4 Advances in Ultra-Low-Power PMICs and Wireless SoCs
- 4.2.5 Ambient IoT Protocol Standardization Opening Certified Self-Powered Device Classes
- 4.2.6 Need to Eliminate Battery Truck Rolls in Hard-to-Reach Rotating Assets
- 4.3 Market Restraints
- 4.3.1 Limited Power Output and Dependence on Intermittent Ambient Energy
- 4.3.2 Narrow Bandwidth and Resonance Mismatch in Piezoelectric MEMS Designs
- 4.3.3 RoHS Lead-Exemption Uncertainty for Piezoelectric Ceramics
- 4.3.4 Leakage Losses and Cold-Start Bottlenecks in Micro-Power Storage Paths
- 4.4 Industry Value Chain Analysis
- 4.5 Regulatory Landscape
- 4.6 Technological Outlook
- 4.7 Porter's Five Forces Analysis
- 4.7.1 Bargaining Power of Suppliers
- 4.7.2 Bargaining Power of Buyers
- 4.7.3 Threat of New Entrants
- 4.7.4 Threat of Substitutes
- 4.7.5 Intensity of Competitive Rivalry
- 4.8 Assessment of Macroeconomic Trends on the Market
5 MARKET SIZE AND GROWTH FORECASTS (VALUE)
- 5.1 By Technology
- 5.1.1 Solar (Photovoltaic) Energy Harvesting
- 5.1.2 Vibration and Piezoelectric Energy Harvesting
- 5.1.3 Thermal Energy Harvesting
- 5.1.4 Radio Frequency Energy Harvesting
- 5.2 By Deployment Type
- 5.2.1 Wired Systems
- 5.2.2 Wireless Systems
- 5.3 By Powering Range
- 5.3.1 Low-Power Devices
- 5.3.2 Medium-to-High Power Devices
- 5.4 By End-User Industry
- 5.4.1 Building and Home Automation
- 5.4.2 Industrial and Manufacturing
- 5.4.3 Consumer Electronics
- 5.4.4 Transportation and Logistics
- 5.4.5 Healthcare and Medical Devices
- 5.4.6 Aerospace and Defense
- 5.5 By Geography
- 5.5.1 North America
- 5.5.1.1 United States
- 5.5.1.2 Canada
- 5.5.1.3 Mexico
- 5.5.2 South America
- 5.5.2.1 Brazil
- 5.5.2.2 Argentina
- 5.5.2.3 Rest of South America
- 5.5.3 Europe
- 5.5.3.1 Germany
- 5.5.3.2 United Kingdom
- 5.5.3.3 France
- 5.5.3.4 Italy
- 5.5.3.5 Spain
- 5.5.3.6 Rest of Europe
- 5.5.4 Asia-Pacific
- 5.5.4.1 China
- 5.5.4.2 Japan
- 5.5.4.3 India
- 5.5.4.4 South Korea
- 5.5.4.5 ASEAN
- 5.5.4.6 Rest of Asia-Pacific
- 5.5.5 Middle East and Africa
- 5.5.5.1 Middle East
- 5.5.5.1.1 Saudi Arabia
- 5.5.5.1.2 United Arab Emirates
- 5.5.5.1.3 Turkey
- 5.5.5.1.4 Rest of the Middle East
- 5.5.5.2 Africa
- 5.5.5.2.1 South Africa
- 5.5.5.2.2 Nigeria
- 5.5.5.2.3 Rest of Africa
- 5.5.5.1 Middle East
- 5.5.1 North America
6 COMPETITIVE LANDSCAPE
- 6.1 Market Concentration
- 6.2 Strategic Moves
- 6.3 Market Share Analysis
- 6.4 Company Profiles (includes Global level Overview, Market level overview, Core Segments, Financials as available, Strategic Information, Market Rank/Share for key companies, Products and Services, and Recent Developments)
- 6.4.1 EnOcean GmbH
- 6.4.2 e-peas S.A.
- 6.4.3 8power Limited
- 6.4.4 Powercast Corporation
- 6.4.5 Smart Material Corporation
- 6.4.6 EH4 GmbH
- 6.4.7 Smart Material GmbH
- 6.4.8 ReVibe Energy AB
- 6.4.9 MEMSYS B.V.
- 6.4.10 Enervibe Ltd.
- 6.4.11 Pyro-E, Inc.
- 6.4.12 WePower Technologies LLC
- 6.4.13 Everactive, Inc.
- 6.4.14 Atmosic, Inc.
- 6.4.15 Wiliot Ltd.
- 6.4.16 Dracula Technologies SAS
- 6.4.17 Exeger Sweden AB (publ)
- 6.4.18 EPISHINE AB
- 6.4.19 Cymbet Corporation
- 6.4.20 MicroGen Systems, Inc.
7 MARKET OPPORTUNITIES AND FUTURE OUTLOOK
- 7.1 White-space and Unmet-Need Assessment

