
PUBLISHER: Mordor Intelligence | PRODUCT CODE: 2066647

PUBLISHER: Mordor Intelligence | PRODUCT CODE: 2066647
Lithium Carbonate - Market Share Analysis, Industry Trends & Statistics, Growth Forecasts (2026 - 2031)
According to Mordor Intelligence, the lithium carbonate market size is expected to increase from 1.15 Million LCE tons in 2025 to 1.41 Million LCE tons in 2026 and reach 3.93 Million LCE tons by 2031, growing at a CAGR of 22.74% over 2026-2031.
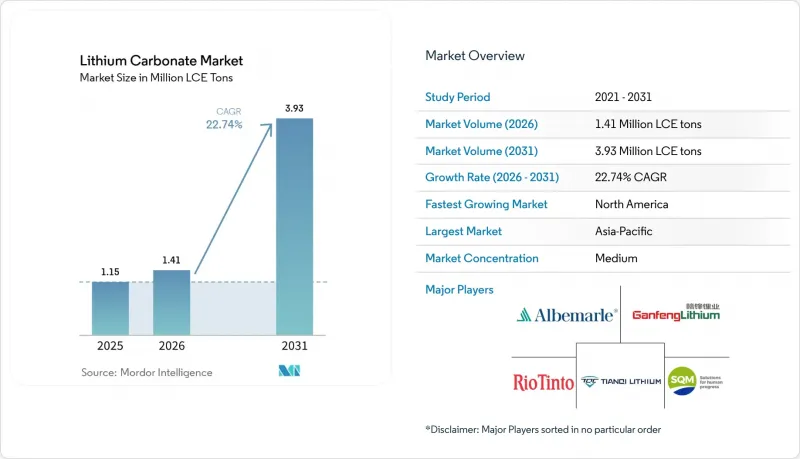
This report is Segmented by Grade (Battery Grade, Technical Grade, and Industrial Grade), Source (Brine, Spodumene, and More), Application (Li-Ion Battery, Glass and Ceramics, and More), End-User Industry (Automotive, Consumer Electronics, and More), and Geography (Asia-Pacific, North America, Europe, South America, and Middle-East and Africa). The Market Forecasts are Provided in Volume (LCE Tons).
Global Lithium Carbonate Market Trends and Insights
Accelerating EV adoption and Battery Manufacturing Capacity Expansion
Global passenger-EV deliveries surpassed 15 million units in 2025, and production plans announced in 2026 will lift cell capacity additions by another 600 GWh. China's LFP penetration exceeded 80% of domestic EV sales between January and November 2025, a chemistry tilt that swings incremental demand toward the lithium carbonate market. Ford's BlueOval Battery Park Michigan entered mass production in Michigan during 2026, while General Motors and Samsung SDI broke ground on a 30 GWh LFP plant in Indiana, jointly locking up multi-year carbonate offtake. Long-term procurement contracts now outnumber spot transactions for automotive cathode manufacturers, helping price discovery but limiting liquidity. Automakers are also co-investing in upstream assets, as evidenced by Ford's offtake tie-up with Lithium Americas' Thacker Pass, reducing exposure to commodity swings.
Rapid Deployment of Energy Storage Systems for Grid Stabilization
Utility-scale battery additions in the United States rose to 57.6 GWh in 2025, four times the 2022 baseline. Front-of-meter providers favor lithium iron phosphate (LFP) modules because 6,000-plus cycle life and a USD 80-100 per kWh price point outperform NMC economics. China's 15th Five-Year Plan calls for every province to install storage equal to at least 10% of peak renewable output, elevating stationary demand to a projected 150-180 GWh in 2026. Analysts expect energy-storage systems to consume 42% of global lithium by 2035, up from 8% in 2020, permanently diluting the automotive industry's historical dominance. Multi-year power-purchase agreements for renewables now require firm storage capacity, and developers are increasingly embedding carbonate supply clauses in engineering-procurement-construction contracts, effectively reserving feedstock years ahead.
Price Volatility and Supply Chain Disruptions
Chinese spot carbonate traded between CNY 60,000 and CNY 120,000 per ton in 2025, a 100% intrayear range that squeezed converter margins. Futures corrected from CNY 180,000 per ton to CNY 144,000 per ton in early 2026 as new Australian concentrate cargoes hit the market, only to rebound when two mid-tier mines idled. Such whiplash discourages hedging because contract structures remain illiquid, pushing smaller producers below cash-cost breakeven and amplifying the next upward spike. Policymakers in China also replaced the new-energy-vehicle purchase-tax exemption with a 5% levy in 2026, causing a front-loaded demand rush in late 2025 and a subsequent trough.
Other drivers and restraints analyzed in the detailed report include:
- Government Incentives and Domestic Content Requirements Driving Localization
- Technology Innovations in Direct Lithium Extraction and Recycling
- Processing Capacity Bottlenecks and Geographic Concentration
For complete list of drivers and restraints, kindly check the Table Of Contents.
Segment Analysis
Battery-grade controlled 82.62% of the lithium carbonate market share in 2025 and is expected to advance at a 23.95% CAGR through 2031. Purity thresholds of 99.5% minimize metal contaminants that catalyze dendrite growth, lowering cell failure rates and justifying a 15-20% price premium over 99.0% industrial grade. Multi-gigafactory operators in the United States, South Korea, and Germany now embed purity guarantees into take-or-pay clauses, effectively ring-fencing volume for high-spec suppliers.
Industrial-grade output, applied in glass, ceramics, and metallurgy, trails at mid-single-digit annual growth. Construction demand correlates with housing and infrastructure cycles rather than EV sales, so the segment experiences less volatility but lower upside. Pharmaceutical-grade carbonate represents under 1% of the lithium carbonate market size yet commands prices above USD 50,000 per ton because of U.S. Pharmacopeia compliance. Producers often maintain dedicated production lines to avoid cross-contamination, creating high fixed costs but steady niche margins.
Brine fields supplied 65.22% of output in 2025, but spodumene (hard-rock) from Western Australia and emerging North American hubs is the fastest-growing source, registering a 23.16% CAGR to 2031. Brine evaporation enjoys operating costs of USD 3,300-4,900 per ton LCE; however, 12-to-18-month pond cycles cannot respond quickly to demand surprises, limiting supply elasticity. Hard-rock concentrate delivers higher recovery rates, typically 70-80%, and can ramp within 6-12 months once a new crusher line is in place, though its USD 3,600-8,000 cost range makes miners sensitive to price dips.
Clay and lepidolite deposits stayed marginal until DLE breakthroughs improved extraction yields beyond 90%. Century Lithium's Nevada pilot now logs operating costs near USD 4,000 per ton and cuts water use dramatically. Recycled carbonate contributes an estimated 3-4% today, but could reach 10-12% of the lithium carbonate market share by 2031 because the European Union's export ban on black mass to non-OECD countries takes effect in December 2026.
Geography Analysis
Asia-Pacific retained 79.13% of global volume in 2025, anchored by China's integrated value chain from refining in Jiangxi and Sichuan to cell assembly in Guangdong and Zhejiang. Although China imports 80% of its spodumene concentrate from Australia, the region's extensive converter park keeps most value addition in-country. Margin pressure emerged in 2025 when spot prices cooled, dropping utilization below 70% in several converters. Japan and South Korea rely on imports of battery-grade carbonate for Panasonic, LG Energy Solution, and Samsung SDI, making them sensitive to Chinese export policy.
North America leads growth with a 28.13% CAGR to 2031. The IRA's USD 35 per kWh cell credit makes domestic carbonate an economic imperative for gigafactories in Michigan, Ohio, Tennessee, and Ontario. Federal loans unlocked Thacker Pass, Kings Mountain, and Piedmont Lithium, collectively targeting over 100,000 tons per year by 2028. Permitting delays remain material, but offtake contracts with Ford and GM de-risk project finance.
Europe benefits from the EUR 1.5 billion Battery Booster Facility supporting refinery and recycling infrastructure. BASF's Schwarzheide plant and ACC's unit in France underpin regional demand. The December 2026 export ban on black mass will compel recyclers to localize capacity, which will back-feed carbonate into gigafactory supply chains.
South America, primarily Chile and Argentina, controlled roughly 40% of brine-based output in 2025. Chile's 400,000 ton quota caps further expansion, while SQM's 210,000 ton Salar de Atacama and Albemarle's 200,000 ton La Negra III operate within that ceiling. Argentina's Olaroz-Cauchari, Sal de Vida, and Pastos Grandes together add 87,500 tons, yet infrastructure gaps and provincial permitting could slow ramp-ups.
- Albemarle Corporation
- Ganfeng Lithium Group Co., Ltd
- Jiangxi Jiuling Lithium Co., Ltd.
- LevertonHELM Limited.
- Lithium Americas Corp.
- Lithium Argentina AG
- Nemaska Lithium
- Pilbara Minerals Limited
- Rio Tinto
- Shandong Ruifu Lithium Co., Ltd.
- Shengxin Lithium Energy Group Co., Ltd.
- SQM
- Tianqi Lithium Corporation
- Xinjiang Zhicun Lithium Industry Co.
Additional Benefits:
- The market estimate (ME) sheet in Excel format
- 3 months of analyst support
TABLE OF CONTENTS
1 Introduction
- 1.1 Study Assumptions and Market Definition
- 1.2 Scope of the Study
2 Research Methodology
3 Executive Summary
4 Market Landscape
- 4.1 Market Overview
- 4.2 Market Drivers
- 4.2.1 Accelerating EV adoption and battery manufacturing capacity expansion
- 4.2.2 Rapid deployment of energy storage systems for grid stabilization
- 4.2.3 Government incentives and domestic content requirements driving localization
- 4.2.4 Battery chemistry transition from NMC to LFP favoring lithium carbonate
- 4.2.5 Technology innovations in direct lithium extraction and recycling
- 4.3 Market Restraints
- 4.3.1 Price volatility and supply chain disruptions
- 4.3.2 Processing capacity bottlenecks and geographic concentration
- 4.3.3 Environmental and water resource constraints in lithium extraction
- 4.4 Value Chain Analysis
- 4.5 Porter's Five Forces
- 4.5.1 Bargaining Power of Suppliers
- 4.5.2 Bargaining Power of Buyers
- 4.5.3 Threat of New Entrants
- 4.5.4 Threat of Substitutes
- 4.5.5 Intensity of Competitive Rivalry
5 Market Size and Growth Forecasts (Volume)
- 5.1 By Grade
- 5.1.1 Battery Grade
- 5.1.2 Technical Grade
- 5.1.3 Industrial Grade
- 5.2 By Source
- 5.2.1 Brine
- 5.2.2 Spodumene (Hard-rock)
- 5.2.3 Lepidolite/Clay
- 5.2.4 Recycled Lithium Carbonate
- 5.3 By Application
- 5.3.1 Li-ion Battery
- 5.3.2 Glass and Ceramics
- 5.3.3 Pharmaceuticals and Dental
- 5.3.4 Aluminum Production
- 5.3.5 Cement Industry
- 5.3.6 Other Applications
- 5.4 By End-user Industry
- 5.4.1 Automotive
- 5.4.2 Consumer Electronics
- 5.4.3 Energy Storage Systems
- 5.4.4 Industrial and Metallurgy
- 5.4.5 Healthcare
- 5.4.6 Construction
- 5.5 By Geography
- 5.5.1 Asia-Pacific
- 5.5.1.1 China
- 5.5.1.2 Japan
- 5.5.1.3 India
- 5.5.1.4 South Korea
- 5.5.1.5 Rest of Asia-Pacific
- 5.5.2 North America
- 5.5.2.1 United States
- 5.5.2.2 Canada
- 5.5.2.3 Mexico
- 5.5.3 Europe
- 5.5.3.1 Germany
- 5.5.3.2 United Kingdom
- 5.5.3.3 France
- 5.5.3.4 Italy
- 5.5.3.5 Spain
- 5.5.3.6 Russia
- 5.5.3.7 Rest of Europe
- 5.5.4 South America
- 5.5.4.1 Brazil
- 5.5.4.2 Argentina
- 5.5.4.3 Rest of South America
- 5.5.5 Middle-East and Africa
- 5.5.5.1 Saudi Arabia
- 5.5.5.2 United Arab Emirates
- 5.5.5.3 South Africa
- 5.5.5.4 Rest of Middle-East and Africa
- 5.5.1 Asia-Pacific
6 Competitive Landscape
- 6.1 Market Concentration
- 6.2 Strategic Moves
- 6.3 Market Share (%)/Ranking Analysis
- 6.4 Company Profiles (includes Global level Overview, Market level overview, Core Segments, Financials as available, Strategic Information, Products and Services, and Recent Developments)
- 6.4.1 Albemarle Corporation
- 6.4.2 Ganfeng Lithium Group Co., Ltd
- 6.4.3 Jiangxi Jiuling Lithium Co., Ltd.
- 6.4.4 LevertonHELM Limited.
- 6.4.5 Lithium Americas Corp.
- 6.4.6 Lithium Argentina AG
- 6.4.7 Nemaska Lithium
- 6.4.8 Pilbara Minerals Limited
- 6.4.9 Rio Tinto
- 6.4.10 Shandong Ruifu Lithium Co., Ltd.
- 6.4.11 Shengxin Lithium Energy Group Co., Ltd.
- 6.4.12 SQM
- 6.4.13 Tianqi Lithium Corporation
- 6.4.14 Xinjiang Zhicun Lithium Industry Co.
7 Market Opportunities and Future Outlook
- 7.1 White-space and Unmet-need Assessment

