
PUBLISHER: Mordor Intelligence | PRODUCT CODE: 2066651

PUBLISHER: Mordor Intelligence | PRODUCT CODE: 2066651
North America Air Conditioning Equipment - Market Share Analysis, Industry Trends & Statistics, Growth Forecasts (2026 - 2031)
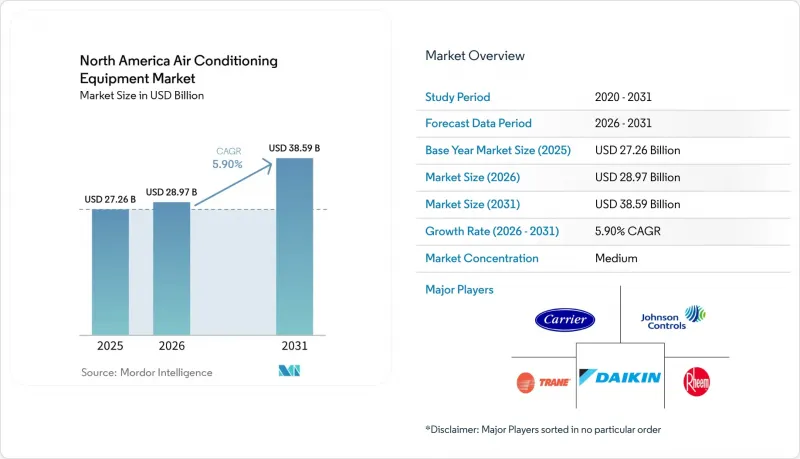
According to Mordor Intelligence, the north america air conditioning equipment market size is expected to grow from USD 27.26 billion in 2025 to USD 28.97 billion in 2026 and is forecast to reach USD 38.59 billion by 2031 at 5.9% CAGR over 2026-2031.
This report is Segmented by Equipment Type (Unitary Air Conditioners, and More), Refrigerant Type (R-410A, and More), Capacity (Less Than 12, 000 BTU Per Hr, and More), Efficiency (Low, and More), End User (Residential, and More), Installation Type (New Construction, and More), Sales Channel (Direct, and More), and Geography. The Market Forecasts are Provided in Terms of Value (USD).
North America Air Conditioning Equipment Market Trends and Insights
Tax-Credit Reinstatement and State-Level Rebate Programs
Expanded USD 2,000 federal credits under the Inflation Reduction Act halve payback periods for ENERGY STAR Most Efficient systems, making early replacement financially attractive. California and New York add point-of-sale rebates that trim total installed cost by up to one-third. Combined incentives shorten the average residential replacement cycle from ten to seven years, elevating baseline demand within the air conditioning equipment market. Utilities now tie eligibility to demand-response enrolment, channelling thousands of connected units into automated peak-shaving programs that in turn validate performance data for manufacturers.
Replacement Demand for Aging Rooftop Units in Commercial Buildings
Rooftop units installed during the 2005-2010 building surge are failing at double-digit rates. Building owners weigh like-for-like swaps against upgrades featuring variable-speed compressors and economizer controls that trim energy use by up to 30%. Rising utility prices and corporate Scope 2 reduction targets are tipping decisions toward high-efficiency retrofits, boosting mid-tonnage shipments and service contract revenue. Secondary markets such as Phoenix, Atlanta, and Dallas account for a sizable share of this replacement wave, which sustains parts and maintenance demand in distributor networks.
SEER2 and AWEF Compliance Cost Pressures on OEM Margins
Stricter SEER2 test procedures reduced published ratings by up to 8%, pushing manufacturers to redesign coils, blowers, and valves. Component upgrades added USD 150-300 to bill-of-materials costs, shaving 1.2 percentage points off gross margins in 2024-2025. Smaller regional brands lacking scale exited price-sensitive product lines, tightening the supply base but also concentrating negotiating power among the top manufacturers.
Other drivers and restraints analyzed in the detailed report include:
- Rapid Growth of Smart-Thermostat and Home-Automation Ecosystems
- Heat-Pump Incentives Shifting Mix Toward Reversible Systems
- Kigali Amendment Phasedown of HFC Refrigerants
For complete list of drivers and restraints, kindly check the Table Of Contents.
Segment Analysis
Unitary systems delivered 46.19% air conditioning equipment market share in 2025, anchored by residential retrofits and builder familiarity. Variable refrigerant flow platforms, however, are pacing the field at 6.78% CAGR through 2031. First-cost premiums are narrowing as manufacturers localize production and as developers value zoned comfort that lowers peak load by up to one-third. Ductless mini-splits dominate accessory-dwelling-unit and urban retrofit projects where ductwork is impractical. Packaged rooftops remain the backbone of warehousing and big-box retail, but modular VRF designs are winning specifications in mixed-use developments seeking operational flexibility.
Project developers increasingly evaluate lifecycle operating expense instead of upfront cost alone. Consequently, VRF bids frequently overtake constant-volume alternatives when energy savings are annualized over ten years. Chillers and PTACs hold niche positions yet face gradual displacement outside their core applications. The broader competitive landscape is shifting toward integrated comfort-control ecosystems that combine air conditioning, heating, and ventilation under a unified service model, reinforcing premium positioning within the air conditioning equipment market.
R-410A retained 57.25% of the installed base in 2025, but its share is eroding as phasedown quotas tighten. R-32, with a 68% lower global-warming potential, is expanding at 6.55% CAGR, propelled by single-component simplicity that eases service and reclamation. R-454B offers near drop-in compatibility for legacy R-410A designs, drawing interest from manufacturers seeking minimal tooling changes, yet supply bottlenecks hampered 2025 rollouts. Mildly flammable A2L classifications oblige contractors to invest in new leak-detection and brazing protocols, increasing training expenses while lifting service revenue for certified technicians.
The refrigerant transition splinters product roadmaps, encouraging some brands to dual-certify equipment. End users delay replacements until supply volatility subsides, lengthening decision cycles for large commercial projects. Meanwhile, reclaim and reuse markets are forming secondary profit streams, with refrigerant recovery firms marketing closed-loop service contracts that align with corporate sustainability goals. This transition period is likely to persist through 2029, keeping refrigerant availability a top-of-mind risk factor in procurement decisions across the air conditioning equipment market.
Units rated 12,001-60,000 BTU accounted for 41.68% of the air conditioning equipment market size in 2025, underpinning most single-family and small-commercial installations. Sub-12,000 BTU products, almost all ductless mini splits, are charting a 6.72% CAGR on the back of urban infill housing, accessory dwelling ordinances, and aging apartment retrofits. Compact compressors running on standard 120-volt circuits simplify homeowner installation approvals and reduce electrical upgrades.
California's zoning reforms alone drove 18,000 accessory dwelling permits in 2025, typically specifying one or two mini-split heads per structure. Distributors respond by broadening SKU assortments, which raises inventory carrying costs but increases cross-sell opportunities for controls and mounting accessories. At the top end, systems above 60,000 BTU maintain relevance in logistics hubs and data centers, yet their longer sales cycles moderate overall volume growth even as per-unit revenue remains elevated.
List of Companies Covered in this Report:
- Daikin Industries Ltd.
- Carrier Global Corp.
- Trane Technologies plc
- Johnson Controls International plc
- Rheem Manufacturing Co.
- Lennox International Inc.
- Mitsubishi Electric Corp.
- LG Electronics Inc.
- Midea Group Co., Ltd.
- Electrolux AB
- Systemair AB
- Robert Bosch GmbH
- Whirlpool Corp.
- GE Appliances
- Fujitsu General Ltd.
- Panasonic Corp.
- Samsung Electronics Co., Ltd.
- Haier Smart Home Co., Ltd.
- Danby Products Ltd.
- Schneider Electric SE
Additional Benefits:
- The market estimate (ME) sheet in Excel format
- 3 months of analyst support
TABLE OF CONTENTS
1 INTRODUCTION
- 1.1 Study Assumptions and Market Definition
- 1.2 Scope of the Study
2 RESEARCH METHODOLOGY
3 EXECUTIVE SUMMARY
4 MARKET LANDSCAPE
- 4.1 Market Overview
- 4.2 Market Drivers
- 4.2.1 Tax-Credit Reinstatement and State-Level Rebate Programs
- 4.2.2 Replacement Demand for Aging Rooftop Units in Commercial Buildings
- 4.2.3 Rapid Growth of Smart-Thermostat and Home-Automation Ecosystems
- 4.2.4 Heat-Pump Incentives Shifting Mix Toward Reversible Systems (Cold-Climate)
- 4.2.5 Data-Center Cooling Capacity Additions (Edge and Hyperscale)
- 4.2.6 Extreme-Heat Events Increasing Cooling-Degree Days
- 4.3 Market Restraints
- 4.3.1 SEER2 and AWEF Compliance Cost Pressures on OEM Margins
- 4.3.2 Kigali Amendment Phasedown of HFC Refrigerants
- 4.3.3 Electrical-Grid Congestion and Demand-Response Penalties
- 4.3.4 Skilled-Labor Shortages for HVAC Installation and Retro-Commissioning
- 4.4 Industry Value-Chain Analysis
- 4.5 Regulatory Landscape
- 4.6 Technological Outlook
- 4.7 Impact of Macroeconomic Factors on the Market
- 4.8 Porter's Five Forces Analysis
- 4.8.1 Bargaining Power of Suppliers
- 4.8.2 Bargaining Power of Buyers/Consumers
- 4.8.3 Threat of New Entrants
- 4.8.4 Threat of Substitutes
- 4.8.5 Intensity of Competitive Rivalry
- 4.9 Distribution Channel Analysis
5 MARKET SIZE AND GROWTH FORECASTS (VALUE)
- 5.1 By Equipment Type
- 5.1.1 Unitary Air Conditioners
- 5.1.1.1 Ducted Split Systems
- 5.1.1.2 Ductless Mini-Splits
- 5.1.1.3 Indoor Packaged and Rooftops
- 5.1.2 Room Air Conditioners
- 5.1.3 Packaged Terminal Air Conditioners
- 5.1.4 Chillers
- 5.1.5 Variable Refrigerant Flow (VRF) Systems
- 5.1.1 Unitary Air Conditioners
- 5.2 By Refrigerant Type
- 5.2.1 R-410A
- 5.2.2 R-32
- 5.2.3 R-454B and R-466A (Next-Gen Low-GWP)
- 5.3 By Capacity (BTU/hr)
- 5.3.1 Less than 12,000 (Less Than 1 Ton)
- 5.3.2 12,001-60,000 (1-5 Tons)
- 5.3.3 More than 60,000 (More than 5 Tons)
- 5.4 By Efficiency (SEER Rating)
- 5.4.1 Low Efficiency (13-15 SEER)
- 5.4.2 Medium Efficiency (16-19 SEER)
- 5.4.3 High Efficiency (More than 20 SEER/SEER2 Equivalent)
- 5.5 By End User
- 5.5.1 Residential
- 5.5.2 Commercial
- 5.5.3 Industrial
- 5.6 By Installation Type
- 5.6.1 New Construction
- 5.6.2 Replacement / Retrofit
- 5.7 By Sales Channel
- 5.7.1 Direct (OEM-to-Contractor)
- 5.7.2 Retail / E-Commerce
- 5.7.3 Wholesalers / Distributors
- 5.8 By Country
- 5.8.1 United States
- 5.8.2 Canada
- 5.8.3 Mexico
6 COMPETITIVE LANDSCAPE
- 6.1 Market Concentration
- 6.2 Strategic Moves
- 6.3 Market Share Analysis
- 6.4 Company Profiles (includes Global Level Overview, Market Level Overview, Core Segments, Financials as available, Strategic Information, Market Rank/Share, Products and Services, Recent Developments)
- 6.4.1 Daikin Industries Ltd.
- 6.4.2 Carrier Global Corp.
- 6.4.3 Trane Technologies plc
- 6.4.4 Johnson Controls International plc
- 6.4.5 Rheem Manufacturing Co.
- 6.4.6 Lennox International Inc.
- 6.4.7 Mitsubishi Electric Corp.
- 6.4.8 LG Electronics Inc.
- 6.4.9 Midea Group Co., Ltd.
- 6.4.10 Electrolux AB
- 6.4.11 Systemair AB
- 6.4.12 Robert Bosch GmbH
- 6.4.13 Whirlpool Corp.
- 6.4.14 GE Appliances
- 6.4.15 Fujitsu General Ltd.
- 6.4.16 Panasonic Corp.
- 6.4.17 Samsung Electronics Co., Ltd.
- 6.4.18 Haier Smart Home Co., Ltd.
- 6.4.19 Danby Products Ltd.
- 6.4.20 Schneider Electric SE
7 MARKET OPPORTUNITIES AND FUTURE OUTLOOK
- 7.1 White-Space and Unmet-Need Assessment

