
PUBLISHER: Mordor Intelligence | PRODUCT CODE: 2066700

PUBLISHER: Mordor Intelligence | PRODUCT CODE: 2066700
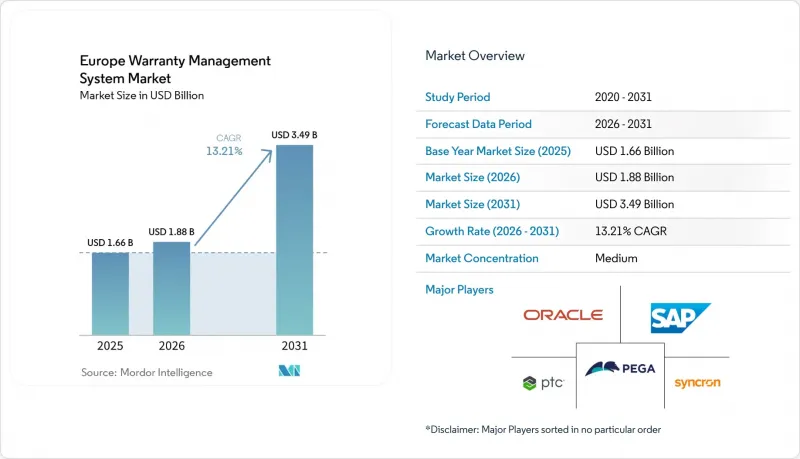
Europe Warranty Management System - Market Share Analysis, Industry Trends & Statistics, Growth Forecasts (2026 - 2031)
According to Mordor Intelligence, the europe warranty management system market size is expected to increase from USD 1.66 billion in 2025 to USD 1.88 billion in 2026 and reach USD 3.49 billion by 2031, growing at a CAGR of 13.21% over 2026-2031.
This report is Segmented by Deployment Type (On-Premise, and Cloud), Software Type (Warranty Intelligence and Analytics, and More), Component (Solutions, and Services), Organization Size (Large Enterprises, and Small and Mid-Sized Enterprises), End-User Industry (Automotive and Transportation, Medical Devices, and More), and Country. The Market Forecasts are Provided in Terms of Value (USD).
Europe Warranty Management System Market Trends and Insights
Rising Cloud-Native Deployments In After-Sales Operations
Manufacturers are migrating from monolithic warranty environments to microservices because elastic compute absorbs telemetry spikes from connected products, shortening rollout cycles from more than a year to under 3 months. Automotive OEMs in Germany and France are already funneling assembly-plant, dealer, and supplier data into unified cloud repositories so that external repairers can retrieve compliant records once the EU Data Act enters force in September 2025. Subscription-based SaaS packages priced below EUR 500 (USD 565) per month are attracting Spanish and Italian SMEs seeking to avoid server capital expenditures. This rapid adoption cycle keeps the total cost of ownership low and accelerates the adoption of predictive analytics pilots.
Increasing European Automotive Recalls And Associated Warranty Costs
Automakers paid EUR 26.163 billion (USD 29.57 billion) in 2024 warranty claims, and a single BMW recall required EUR 1 billion (USD 1.13 billion) in provisions. Such pressure drives investment in automated rules engines that reject fraudulent claims and orchestrate supplier chargebacks in hours rather than weeks. The forthcoming Right to Repair directive, which extends warranty periods when customers choose independent repairers, amplifies administrative complexity and favors configurable policy engines. By unifying claim histories with supply-chain quality data, early-warning dashboards can trigger field actions before mass campaigns become inevitable.
Fragmented Legacy IT Landscapes In Traditional Manufacturing Firms
Mid-tier suppliers run decades-old ERP and spreadsheet workflows that lack common data schemas, adding 18-36 months of cleansing and interface work before cloud migration can start. Italian and Spanish plants that still rely on SAP R/3 or Oracle E-Business Suite often face EUR 500,000 (USD 565,000) integration tabs, discouraging adoption until warranty costs exceed 3% of revenue. Parallel domestic and export databases compound the challenge because each set follows different regulatory taxonomies, inflating reconciliation overhead.
Other drivers and restraints analyzed in the detailed report include:
- Digital Transformation Mandates Under EU Data Act Compliance
- Shift Toward Predictive Analytics For Proactive Warranty Cost Reduction
- Shortage Of Skilled Warranty Data Scientists
For complete list of drivers and restraints, kindly check the Table Of Contents.
Segment Analysis
On-premises installation held 52.18% market share, as many organizations, particularly in the manufacturing, automotive, and industrial sectors, prioritize stringent control over their data and IT environments. Cloud solutions are advancing at 14.21% CAGR. In Germany and France, automotive OEMs use cloud (hybrid) architectures, retaining sensitive design data in private clouds while routing dealer claims through public endpoints during recall spikes, ensuring performance remains stable across distributed dealer networks. Southern European SMEs demonstrate a different pattern, skipping hybrid stages altogether and subscribing directly to fully managed SaaS, driven by pay-per-use economics and the ability to roll out in eight weeks. While defense contractors in the United Kingdom still hedge toward private cloud to satisfy security protocols, their share of overall spending is small.
Looking ahead, the European warranty management system market will see on-premises budgets shrink after 2028, when extended support terms for many client-server platforms end. Vendors prepare by packaging lift-and-shift accelerators that migrate rule libraries, claim histories, and supplier contracts into cloud schemas with minimal downtime. As an added incentive, public cloud providers bundle compliance documentation and automated encryption, enabling smaller manufacturers to pass regulatory audits without hiring additional security architects.
Claim management engines will remain the mandatory backbone for capturing submissions, yet investment momentum is shifting toward intelligence overlays that detect anomalies, predict failures, and orchestrate supplier recovery. The Europe warranty management system market share for claim management stood at 41.56% in 2025, but analytics portfolios, growing at 14.58% CAGR, are becoming a pivotal buying criterion. OEMs now evaluate platforms on the accuracy of predictive maintenance scores, not just the number of configurable claim fields. In Germany, early adopters benchmark cost-avoidance savings, recording 25% reductions within a year of model deployment.
Extended service-contract modules gain traction because automakers and appliance brands embed multi-year coverage into upfront pricing, adding complex renewal and revenue-recognition logic. Parts returns and supplier recovery tools, although niche, generate outsized value by reallocating repair liability back to component makers. Solution providers that furnish visual fault classification, real-time return merchandise authorization (RMA), and automatic debit note creation gain favor with procurement teams that measure performance on recovery yield rather than throughput.
List of Companies Covered in this Report:
- Oracle Corporation
- SAP SE
- PTC Inc.
- Pegasystems Inc.
- Syncron AB
- Tavant Technologies Inc.
- IFS AB
- ServiceNow Inc.
- Salesforce Inc.
- IBM Corporation
- DXC Technology Company
- Infosys Limited
- Wipro Limited
- Tech Mahindra Limited
- Accenture plc
- Astea International Inc.
- Mize Inc.
- ServiceMax Inc.
- Intranel Consulting Solutions Ltd.
- Intellinetics Inc.
Additional Benefits:
- The market estimate (ME) sheet in Excel format
- 3 months of analyst support
TABLE OF CONTENTS
1 INTRODUCTION
- 1.1 Study Assumptions and Market Definition
- 1.2 Scope of the Study
2 RESEARCH METHODOLOGY
3 EXECUTIVE SUMMARY
4 MARKET LANDSCAPE
- 4.1 Market Overview
- 4.2 Market Drivers
- 4.2.1 Rising Cloud Native Deployments in After-Sales Operations
- 4.2.2 Increasing European Automotive Recalls and Associated Warranty Costs
- 4.2.3 Digital Transformation Mandates Under EU Data Act Compliance
- 4.2.4 Shift Toward Predictive Analytics for Proactive Warranty Cost Reduction
- 4.2.5 Growing Adoption of Embedded Warranty Offerings by OEMs
- 4.2.6 ESG-Linked Pressure to Extend Product Lifecycles and Reduce E-Waste
- 4.3 Market Restraints
- 4.3.1 Fragmented Legacy IT Landscapes in Traditional Manufacturing Firms
- 4.3.2 Shortage of Skilled Warranty Data Scientists
- 4.3.3 High Initial Integration Costs for SMEs
- 4.3.4 Cybersecurity and GDPR-Related Concerns Over Warranty Data Sharing
- 4.4 Industry Value-Chain Analysis
- 4.5 Regulatory Landscape
- 4.6 Technological Outlook
- 4.7 Impact of Macroeconomic Factors on the Market
- 4.8 Porter's Five Forces Analysis
- 4.8.1 Threat of New Entrants
- 4.8.2 Bargaining Power of Suppliers
- 4.8.3 Bargaining Power of Buyers
- 4.8.4 Threat of Substitutes
- 4.8.5 Competitive Rivalry
5 MARKET SIZE AND GROWTH FORECASTS (VALUE)
- 5.1 By Deployment Type
- 5.1.1 On-premise
- 5.1.2 Cloud (Public, Private, Hybrid)
- 5.2 By Software Type
- 5.2.1 Warranty Intelligence and Analytics
- 5.2.2 Claim Management
- 5.2.3 Service Contract Administration
- 5.2.4 Parts Returns and Supplier Recovery
- 5.3 By Component
- 5.3.1 Solutions
- 5.3.2 Services
- 5.3.2.1 Professional Services
- 5.3.2.2 Managed Services
- 5.4 By Organization Size
- 5.4.1 Large Enterprises
- 5.4.2 Small and Mid-sized Enterprises (SMEs)
- 5.5 By End-user Industry
- 5.5.1 Automotive and Transportation
- 5.5.2 Industrial Equipment and Heavy Machinery
- 5.5.3 Consumer Durables and Home Appliances
- 5.5.4 Construction and Building Materials
- 5.5.5 Medical Devices
- 5.5.6 Aerospace and Defence
- 5.5.7 Other End-user Industries
- 5.6 By Country
- 5.6.1 Germany
- 5.6.2 United Kingdom
- 5.6.3 France
- 5.6.4 Italy
- 5.6.5 Spain
- 5.6.6 Netherlands
- 5.6.7 Rest of Europe
6 COMPETITIVE LANDSCAPE
- 6.1 Market Concentration
- 6.2 Strategic Moves
- 6.3 Market Share Analysis
- 6.4 Company Profiles (includes Global Level Overview, Market Level Overview, Core Segments, Financials as available, Strategic Information, Market Rank/Share, Products and Services, Recent Developments)
- 6.4.1 Oracle Corporation
- 6.4.2 SAP SE
- 6.4.3 PTC Inc.
- 6.4.4 Pegasystems Inc.
- 6.4.5 Syncron AB
- 6.4.6 Tavant Technologies Inc.
- 6.4.7 IFS AB
- 6.4.8 ServiceNow Inc.
- 6.4.9 Salesforce Inc.
- 6.4.10 IBM Corporation
- 6.4.11 DXC Technology Company
- 6.4.12 Infosys Limited
- 6.4.13 Wipro Limited
- 6.4.14 Tech Mahindra Limited
- 6.4.15 Accenture plc
- 6.4.16 Astea International Inc.
- 6.4.17 Mize Inc.
- 6.4.18 ServiceMax Inc.
- 6.4.19 Intranel Consulting Solutions Ltd.
- 6.4.20 Intellinetics Inc.
7 MARKET OPPORTUNITIES AND FUTURE OUTLOOK
- 7.1 White-Space and Unmet-Need Assessment

