
PUBLISHER: Mordor Intelligence | PRODUCT CODE: 2066710

PUBLISHER: Mordor Intelligence | PRODUCT CODE: 2066710
Electric Two-Wheeler - Market Share Analysis, Industry Trends & Statistics, Growth Forecasts (2026 - 2031)
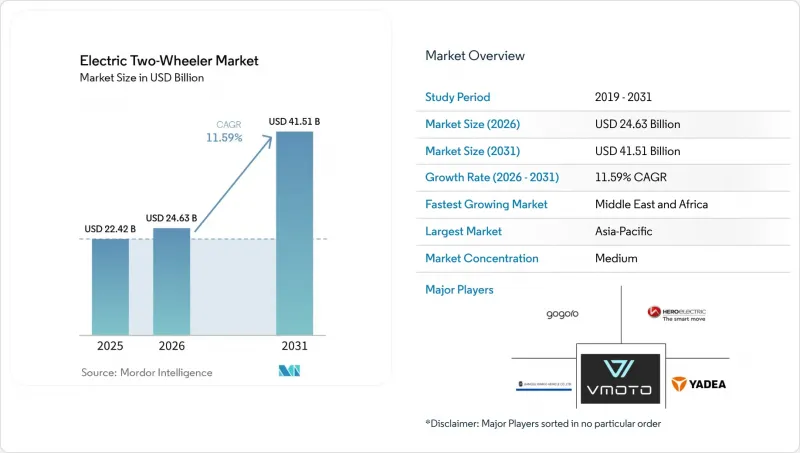
According to Mordor Intelligence, the electric two-Wheeler market size is estimated at USD 24.63 billion in 2026, and is expected to reach USD 41.51 billion by 2031, at a CAGR of 11.59% during the forecast period (2026-2031).
This report is Segmented by Vehicle Type (Scooters and Motorcycles), Motor Power (Less Than or Equal To 1. 0 KW and More), Voltage (48 V, 60 V, 72 V, and Others), Battery Config (Fixed and More), Motor Type (BLDC and Others), Price Band (Less Than or Equal To USD 1, 000 and More), End User (B2C and More), Sales Channel (Online and Offline), and Geography. Forecasts in Value (USD) and Volume (Units).
Global Electric Two-Wheeler Market Trends and Insights
Falling Battery Prices Accelerate TCO Parity
In 2024, lithium-ion pack costs experienced a significant decline, marking a notable year-on-year reduction. Projections suggest further decreases in the near future. Achieving this milestone eliminates the upfront premium over 125 cc petrol scooters in markets like India, Indonesia, and Vietnam. This shift paves the way for organic demand, independent of subsidies. Notably, in Tier-2 Indian cities, brands like Ather Energy and TVS Motor report that sales of electric scooters, free from subsidies, now account for a substantial portion of their monthly volumes. Manufacturers are channeling these cost savings into enhanced offerings; for instance, Ola Electric rolled out an extended warranty program in early 2025 . Overall, supply-chain scaling and battery cost optimization continue to be the primary growth drivers for the electric two-wheeler market.
Rapid Growth of Gig-Economy Delivery Fleets
Food-delivery platforms, such as Zomato, are setting ambitious targets, aiming for a significant number of electric units by the end of the decade. Meanwhile, Swiggy has inked a deal with Zypp Electric, planning to roll out a substantial fleet of scooters within the next few years. With daily runs covering moderate to long distances, electric vehicles can reduce total ownership costs significantly compared to petrol, especially when battery swapping minimizes downtime. In 2024, Gogoro clinched fleet contracts with Uber and Rapido, establishing a presence in Bangalore and Hyderabad, due to its extensive swap-station network . Under government mandates, Indonesia's GoTo Group is on track to electrify a considerable portion of its Gojek fleet within the next few years, underscoring Asia's leading role in the electric vehicle push. While standardized swapping protocols face fragmentation outside Taiwan, the formation of consortia hints at a future convergence.
Subsidy Phase-Outs in China & Europe
In early 2024, Germany's termination of purchase grants in late 2023 and France's reduction of its ecological bonus at the beginning of 2024 resulted in significant declines in registrations. While China ended direct consumer subsidies in late 2022, purchase-tax exemptions remain in effect for a few more years. As incentives dwindle, OEMs are compelled to tighten their bill-of-materials costs, particularly impacting smaller players with limited scale. Markets like India's FAME-II scheme, known for their predictable multiyear programs, showcase steadier demand curves. Given the fiscal pressures, it's likely that any future extensions will be less generous, underscoring the importance of intrinsic cost competitiveness.
Other drivers and restraints analyzed in the detailed report include:
- Urban Low-Emission-Zone Policies Spur Adoption
- Localised Cell-To-Pack Manufacturing Incentives
- Fragmented Charging Standards Hamper Roaming
For complete list of drivers and restraints, kindly check the Table Of Contents.
Segment Analysis
Scooters dominated the electric two-wheeler market with 94.71% of global volume in 2025. Their step-through design, under-seat storage, and lightweight frames suit congested urban trips and courier stops. Delivery platforms prefer scooters because riders can mount and dismount quickly, lowering service times. Motorcycles, although a residual share, are expanding at 11.61% CAGR as performance-oriented riders seek highway-legal speed ceilings and aggressive styling. Revolt's RV400 and Emflux's liquid-cooled ONE exemplify this transition toward higher power figures.
Momentum around motorcycles suggests a bifurcation of the electric two-wheeler market. Mass-market adoption will remain scooter-centric through 2031; however, premium customers are willing to pay for acceleration under four seconds and 100 km-plus real-world range. Brands with combustion heritage in sport and touring categories hold latent brand equity that they can leverage once battery cost curves allow. Conversely, scooter incumbents risk losing aspirational buyers unless they extend line-ups into motorcycle silhouettes. Segment innovation, therefore, revolves around expanding form factors rather than incremental range gains.
Models in the 1.1-3.0 kW bracket accounted for 39.78% of sales in 2025, balancing cost, curb weight, and city-grade performance. They suit daily commutes under 60 km and remain the default for price-sensitive buyers. Yet the above-5.0 kW class is the fastest-growing, logging an 11.67% CAGR as ASEAN and Latin American regulators align licensing norms so higher-output scooters can share arterial roads with cars. Ather's 450 Apex demonstrates the appeal of near-instant torque at traffic lights without sacrificing range.
The low-power less than or equal to 1.0 kW sub-segment, once popular in China's rural regions, is losing relevance because dropping battery prices erode the savings that justified limited performance. Conversely, the mid-power 3.1-5.0 kW tier is becoming a transitional step for riders upgrading from entry scooters but not yet ready to absorb the price premium or added weight of larger batteries. Power-class distribution will keep tilting upward as the cost per kWh settles below USD 90, enabling OEMs to ship larger packs without overshooting mass-market price bands.
Sixty-volt systems held 37.73% of the electric two-wheeler market share in 2025, largely because their component ecosystem-controllers, chargers, and battery modules-is mature and cost-optimized. Seventy-two-volt platforms, however, are growing at an 11.71% CAGR, aided by DC fast-chargers that deliver 3 kW and reduce minimal charge times to around 90 minutes. Gogoro uses 50.4 V packs in series to reach 100.8 V for high-duty cycles, demonstrating the flexibility of modular configurations.
Growing public-charging density influences voltage selection more than intrinsic efficiency because owners now cross-shop vehicles against the availability of compatible hardware. Forty-eight-volt architectures, once dominant in lead-acid conversions, are sliding as lithium chemistries eliminate past voltage ceilings. Experimental 96-V and 120-V prototypes will remain niche until standards emerge. OEMs therefore face a strategic trade-off: align with prevailing grid voltage norms or risk orphaning customers when traveling outside urban centers.
Geography Analysis
List of Companies Covered in this Report:
- Yadea Group Holdings Ltd.
- Jiangsu Xinri E-Vehicle Co. Ltd.
- Hero Electric Vehicles Pvt. Ltd.
- VMOTO SOCO ITALY SRL
- Gogoro Limited
- Ather Energy Pvt. Ltd.
- NIU Technologies
- Ola Electric Technologies Pvt. Ltd.
- TVS Motor Company Ltd.
- Bajaj Auto Ltd.
- Revolt Intellicorp Pvt. Ltd.
- Segway-Ninebot Group
- Horwin Global
- Aima Technology Group
- Super Soco Italy SRL
- Emflux Motors
- Lifan Technology Group
- Pure EV
Additional Benefits:
- The market estimate (ME) sheet in Excel format
- 3 months of analyst support
TABLE OF CONTENTS
1 Introduction
- 1.1 Study Assumptions & Market Definition
- 1.2 Scope of the Study
2 Research Methodology
3 Executive Summary
4 Market Landscape
- 4.1 Key Industry Trends
- 4.1.1 Population & Urbanization Rate
- 4.1.2 GDP per Capita (PPP) & Median Disposable Income
- 4.1.3 Consumer Spend on Vehicle Purchase/Transport (CVP)
- 4.1.4 Fuel Prices
- 4.1.5 Interest Rate for 2W/Auto Loans & Credit Access
- 4.1.6 2W Penetration (units/1,000 people) & Parc
- 4.1.7 Dealer/Service Network Density
- 4.1.8 Two-Wheeler Trade & Revenue (Imports/Exports)
- 4.1.9 Electrification Readiness (Infrastructure & Power)
- 4.1.10 Battery Pack Price & Chemistry Mix
- 4.1.11 Battery Swapping Stations (Network Density & Util.)
- 4.1.12 New Model Pipeline & OEM Coverage
- 4.1.13 Value-Chain Localization & Assembly Capacity
- 4.1.14 Regulatory Framework
- 4.2 Market Drivers
- 4.2.1 Falling Battery Prices Accelerate TCO Parity
- 4.2.2 Rapid Growth of Gig-Economy Delivery Fleets
- 4.2.3 Urban Low-Emission-Zone Policies Spur Adoption
- 4.2.4 Localised Cell-To-Pack Manufacturing Incentives
- 4.2.5 OEM Modular Platforms Cut Development Cycles
- 4.2.6 AI-Based Battery Management Extends Warranty Life
- 4.3 Market Restraints
- 4.3.1 Subsidy Phase-Outs in China & Europe
- 4.3.2 2W-Specific Finance Remains Under-Penetrated
- 4.3.3 Fragmented Charging Standards Hamper Roaming
- 4.3.4 Thermal Events Damage Consumer Trust
- 4.4 Value / Supply-Chain Analysis
- 4.5 Regulatory Landscape
- 4.6 Technological Outlook
- 4.7 Porter's Five Forces
- 4.7.1 Threat of New Entrants
- 4.7.2 Bargaining Power of Suppliers
- 4.7.3 Bargaining Power of Buyers
- 4.7.4 Threat of Substitutes
- 4.7.5 Competitive Rivalry
5 Market Size & Growth Forecasts (Value (USD) and Volume (Units))
- 5.1 By Vehicle Type
- 5.1.1 Scooters
- 5.1.2 Motorcycles
- 5.2 By Motor Power
- 5.2.1 Less than or equal to 1.0 kW
- 5.2.2 1.1-3.0 kW
- 5.2.3 3.1-5.0 kW
- 5.2.4 More than 5.0 kW
- 5.3 By Voltage Platform
- 5.3.1 48 V
- 5.3.2 60 V
- 5.3.3 72 V
- 5.3.4 Others
- 5.4 By Battery Configuration
- 5.4.1 Fixed Pack
- 5.4.2 Swappable (Single)
- 5.4.3 Swappable (Dual)
- 5.5 By Motor Type
- 5.5.1 BLDC
- 5.5.2 PMSM
- 5.5.3 Others
- 5.6 By Price Band (USD)
- 5.6.1 Less than or equal to 1,000
- 5.6.2 1,000-1,500
- 5.6.3 1,501-2,000
- 5.6.4 2,001-3,000
- 5.6.5 3,001-5,000
- 5.6.6 More than 5,000
- 5.7 By End User
- 5.7.1 B2C
- 5.7.2 B2B
- 5.7.3 Ride-hail / Bike-Taxi / Rental / Tourism
- 5.7.4 Delivery & Logistics
- 5.7.5 Corporate & SME Fleets
- 5.7.6 Others (Govt., NGO, Institutional)
- 5.8 By Sales Channel
- 5.8.1 Online
- 5.8.2 Offline
- 5.9 By Geography
- 5.9.1 North America
- 5.9.1.1 United States
- 5.9.1.2 Canada
- 5.9.1.3 Rest of North America
- 5.9.2 South America
- 5.9.2.1 Brazil
- 5.9.2.2 Argentina
- 5.9.2.3 Rest of South America
- 5.9.3 Europe
- 5.9.3.1 Germany
- 5.9.3.2 United Kingdom
- 5.9.3.3 France
- 5.9.3.4 Italy
- 5.9.3.5 Russia
- 5.9.3.6 Spain
- 5.9.3.7 Rest of Europe
- 5.9.4 Asia Pacific
- 5.9.4.1 China
- 5.9.4.2 India
- 5.9.4.3 Japan
- 5.9.4.4 South Korea
- 5.9.4.5 Rest of Asia Pacific
- 5.9.5 Middle East and Africa
- 5.9.5.1 Saudi Arabia
- 5.9.5.2 United Arab Emirates
- 5.9.5.3 South Africa
- 5.9.5.4 Turkey
- 5.9.5.5 Rest of Middle East and Africa
- 5.9.1 North America
6 Competitive Landscape
- 6.1 Market Concentration
- 6.2 Strategic Moves
- 6.3 Market Share Analysis
- 6.4 Company Profiles (includes Global Level Overview, Market Level Overview, Core Segments, Financials as Available, Strategic Information, Market Rank/Share for Key Companies, Products and Services, SWOT Analysis, and Recent Developments)
- 6.4.1 Yadea Group Holdings Ltd.
- 6.4.2 Jiangsu Xinri E-Vehicle Co. Ltd.
- 6.4.3 Hero Electric Vehicles Pvt. Ltd.
- 6.4.4 VMOTO SOCO ITALY SRL
- 6.4.5 Gogoro Limited
- 6.4.6 Ather Energy Pvt. Ltd.
- 6.4.7 NIU Technologies
- 6.4.8 Ola Electric Technologies Pvt. Ltd.
- 6.4.9 TVS Motor Company Ltd.
- 6.4.10 Bajaj Auto Ltd.
- 6.4.11 Revolt Intellicorp Pvt. Ltd.
- 6.4.12 Segway-Ninebot Group
- 6.4.13 Horwin Global
- 6.4.14 Aima Technology Group
- 6.4.15 Super Soco Italy SRL
- 6.4.16 Emflux Motors
- 6.4.17 Lifan Technology Group
- 6.4.18 Pure EV
7 Market Opportunities & Future Outlook
8 Key Strategic Questions for CEOs

