
PUBLISHER: Mordor Intelligence | PRODUCT CODE: 2066730

PUBLISHER: Mordor Intelligence | PRODUCT CODE: 2066730
Elevator And Escalator - Market Share Analysis, Industry Trends & Statistics, Growth Forecasts (2026 - 2031)
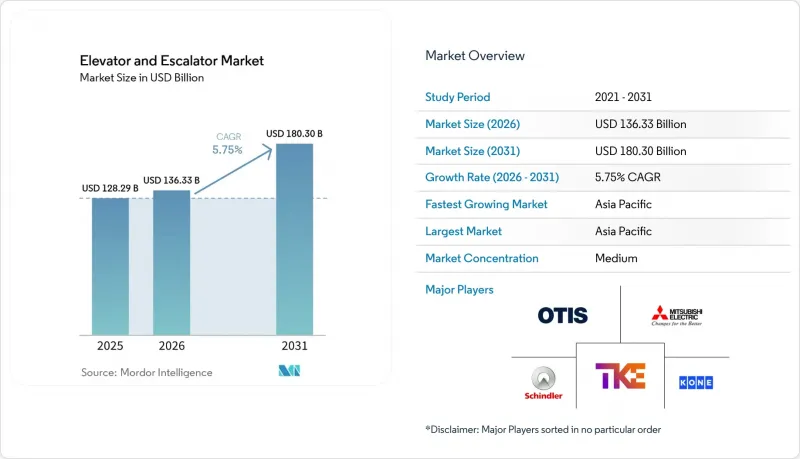
According to Mordor Intelligence, the elevator and escalator market size is expected to increase from USD 128.29 billion in 2025 to USD 136.33 billion in 2026 and reach USD 180.30 billion by 2031, growing at a CAGR of 5.75% over 2026-2031.
This report is Segmented by Product Type (Elevators, Escalators, and Moving Walkways), Technology (Traction, Hydraulic, Machine-Room-Less, and Vacuum/Pneumatic), Service (New Installation, Maintenance and Repair, and Modernisation), End-User (Residential, Commercial, Infrastructure, and Industrial), and Geography (North America, Europe, Asia-Pacific, South America, and Middle East and Africa).
Global Elevator And Escalator Market Trends and Insights
Rapid Urbanization & High-Rise Construction Boom
The Council on Tall Buildings and Urban Habitat counted 141 buildings over 200 m completed in 2025 and anticipates a similar tally for 2026 despite macro headwinds. China's share is slipping as liquidity strains curb new starts, yet Gulf Cooperation Council mega-projects fill part of the gap, driving steady demand for the elevator & escalator market. Riyadh alone schedules 340,000 new homes and 4.8 million m2 of offices by 2030, locking in future equipment orders. India installed 60,000 units in 2024 and now ranks second worldwide by volume, reflecting a nationwide pivot from suburban sprawl to vertical densification. However, 259 global stalled projects temper headline forecasts, underscoring near-term revenue visibility issues for OEMs.
Ageing Installed Base Requiring Modernisation
Otis estimates 7 million elevators surpassed 20 years of service in 2024 and projects 15 million by 2034, twice today's pool. Europe's 220 million-plus buildings, 85% of which pre-date 2001, face 74 safety deficiencies under EN 81-80 that trigger modernization. KONE positions its MonoSpace 500 as a drop-in upgrade offering 74% energy savings over 1990s models. Japan's mandatory seismic retrofits for 30-year-old structures further spur replacements. Modernization contracts bundle multi-year service, cementing recurring revenue for OEMs.
High Upfront Capital Expenditure
Mid-rise towers in India need 4-6 elevators costing USD 40,000-80,000 each, a bill often deferred when developers face funding gaps. Full controller replacements in Europe cost up to USD 300,000 per unit, stretching 20-year amortization schedules. In South America, multilateral lending bottlenecks delay disbursements, pushing elevator procurement to later project phases. Performance-based leasing converts CapEx into OpEx but burdens OEM balance sheets, a hurdle for smaller regional players.
Other drivers and restraints analyzed in the detailed report include:
- Stricter Safety Codes Accelerating Replacements
- AI-Driven Predictive Maintenance Adoption
- Volatile Raw-Material Prices (Steel, Chips)
For complete list of drivers and restraints, kindly check the Table Of Contents.
Segment Analysis
Passenger elevators captured 64.1% of the elevator & escalator market share in 2025. The segment benefits from residential high-rises and commercial towers, but moving walkways are forecast to post the fastest 7.4% CAGR, buoyed by airport expansions such as Sacramento International's 2026 concourse upgrades. Freight elevators serve e-commerce warehouses, while home elevators gain traction in accessibility retrofits. High-speed units remain niche but strategic: KONE's 10 m/s lifts for Jeddah Tower illustrate demand for ultra-tall applications.
Escalators, especially parallel layouts, dominate retail malls and metro stations. Inclined moving walkways see limited use outside hillside transits due to higher costs. Supertall buildings increasingly adopt express lifts and sky lobbies, reallocating budgets away from escalators toward high-speed passenger elevators. Moving walkways in airports like Miami International, which operates 96 units under a 2025 Otis contract, underscore the infrastructure segment's tilt toward horizontal conveyance.
Traction systems commanded 70% of the elevator & escalator market share in 2025. Machine-room-less traction units are projected to expand at a 7.8% CAGR, reclaiming 10-15 m2 per shaft and winning Class A/B ISO 25745 ratings that hydraulic rivals cannot match. KONE's MonoSpace 500 pairs permanent-magnet motors with regenerative drives, cutting annual electricity by up to 40%.
Hydraulic elevators retreat under tighter environmental rules that restrict mineral oils. Vacuum lifts occupy a residential niche, prized for minimal pit depth but limited to 3-4 passengers. Advanced ropes such as KONE's carbon-fiber UltraRope reduce cable weight 90%, enabling >500 m travel heights and reinforcing traction's dominance in supertall projects. Building-code updates from the ICC allow in-hoistway controllers, accelerating global MRL adoption.
Geography Analysis
Asia-Pacific produced 62.8% of 2025 revenue for the elevator & escalator market and is forecast to grow 6.2% through 2031. India's tier-2 and tier-3 cities now deliver half of domestic installations, while China's modernization opportunity offsets new-build slowdowns linked to 193 stalled projects. ASEAN nations such as Vietnam and Indonesia attract manufacturing FDI that boosts mid-rise commercial demand.
North America and Europe grow mainly via modernization. EN 81-80 safety mandates and energy codes underpin steady replacement cycles in Europe, while California's Title 24 and NYC's Local Law 97 drive efficiency-based retrofits in the United States. The Middle East & Africa posts the highest regional CAGR, propelled by Saudi Vision 2030 mega-developments and UAE tourism infrastructure; NEOM alone envisions 382,500 homes and 3 million m2 offices. South America is mixed: Chile invests in metro extensions, whereas Brazil's currency volatility delays some projects.
- Otis Worldwide Corporation
- Kone Oyj
- Schindler Group
- TK Elevator (ThyssenKrupp)
- Mitsubishi Electric Corp.
- Hitachi Ltd.
- Fujitec Co. Ltd.
- Toshiba Elevator & Building Systems
- Hyundai Elevator Co. Ltd.
- Sigma Elevator (CJ Corporation)
- Canny Elevator Co. Ltd.
- Johnson Lifts Pvt Ltd.
- Orona S. Coop.
- Wittur Group
- Kleemann Hellas
- Stannah Lifts Holdings Ltd.
- Eita Elevator (M) Sdn Bhd
- Gulf Elevator & Escalator Co.
- Alpine Elevator Co.
- Savaria Corporation
- Hitachi-Yungtay Elevator (Taiwan)
Additional Benefits:
- The market estimate (ME) sheet in Excel format
- 3 months of analyst support
TABLE OF CONTENTS
1 Introduction
- 1.1 Study Assumptions & Market Definition
- 1.2 Scope of the Study
2 Research Methodology
3 Executive Summary
4 Market Landscape
- 4.1 Market Overview
- 4.2 Market Drivers
- 4.2.1 Rapid urbanisation & high-rise construction boom
- 4.2.2 Ageing installed base requiring modernisation
- 4.2.3 Stricter safety codes accelerating replacements
- 4.2.4 Escalating demand for green-labelled products
- 4.2.5 AI-driven predictive maintenance adoption
- 4.2.6 Touch-less & antimicrobial interface demand
- 4.3 Market Restraints
- 4.3.1 High upfront capital expenditure
- 4.3.2 Volatile raw-material prices (steel, chips)
- 4.3.3 Semiconductor-grade component shortages
- 4.3.4 Scarcity of certified technicians in Tier-2/3 cities
- 4.4 Supply-Chain Analysis
- 4.5 Regulatory Landscape
- 4.6 Technological Outlook
- 4.7 Porter's Five Forces
- 4.7.1 Bargaining Power of Suppliers
- 4.7.2 Bargaining Power of Consumers
- 4.7.3 Threat of New Entrants
- 4.7.4 Threat of Substitutes
- 4.7.5 Intensity of Competitive Rivalry
5 Market Size & Growth Forecasts
- 5.1 By Product Type
- 5.1.1 Elevators (Passenger Elevators, Freight Elevators, Home Elevators and High-speed/High-rise Elevators)
- 5.1.2 Escalators (Parallel, Multi-Parallel and Criss-Cross)
- 5.1.3 Moving Walkways (Horizontal and Inclined)
- 5.2 By Technology
- 5.2.1 Traction
- 5.2.2 Hydraulic
- 5.2.3 Machine-Room-Less (MRL)
- 5.2.4 Vacuum/Pneumatic
- 5.3 By Service
- 5.3.1 New Installation
- 5.3.2 Maintenance and Repair
- 5.3.3 Modernisation
- 5.4 By End-user
- 5.4.1 Residential
- 5.4.2 Commercial (Offices, Retail and Malls and Hospitality)
- 5.4.3 Infrastructure (Airports and Metro and Rail)
- 5.4.4 Industrial
- 5.5 By Geography
- 5.5.1 North America
- 5.5.1.1 United States
- 5.5.1.2 Canada
- 5.5.1.3 Mexico
- 5.5.2 Europe
- 5.5.2.1 Germany
- 5.5.2.2 United Kingdom
- 5.5.2.3 France
- 5.5.2.4 Italy
- 5.5.2.5 NORDIC Countries
- 5.5.2.6 Russia
- 5.5.2.7 Rest of Europe
- 5.5.3 Asia-Pacific
- 5.5.3.1 China
- 5.5.3.2 India
- 5.5.3.3 Japan
- 5.5.3.4 South Korea
- 5.5.3.5 ASEAN Countries
- 5.5.3.6 Rest of Asia-Pacific
- 5.5.4 South America
- 5.5.4.1 Brazil
- 5.5.4.2 Argentina
- 5.5.4.3 Chile
- 5.5.4.4 Rest of South America
- 5.5.5 Middle East and Africa
- 5.5.5.1 Saudi Arabia
- 5.5.5.2 United Arab Emirates
- 5.5.5.3 South Africa
- 5.5.5.4 Egypt
- 5.5.5.5 Rest of Middle East and Africa
- 5.5.1 North America
6 Competitive Landscape
- 6.1 Market Concentration
- 6.2 Strategic Moves (M&A, Partnerships, PPAs)
- 6.3 Market Share Analysis (Market Rank/Share for key companies)
- 6.4 Company Profiles (includes Global level Overview, Market level overview, Core Segments, Financials as available, Strategic Information, Products & Services, and Recent Developments)
- 6.4.1 Otis Worldwide Corporation
- 6.4.2 Kone Oyj
- 6.4.3 Schindler Group
- 6.4.4 TK Elevator (ThyssenKrupp)
- 6.4.5 Mitsubishi Electric Corp.
- 6.4.6 Hitachi Ltd.
- 6.4.7 Fujitec Co. Ltd.
- 6.4.8 Toshiba Elevator & Building Systems
- 6.4.9 Hyundai Elevator Co. Ltd.
- 6.4.10 Sigma Elevator (CJ Corporation)
- 6.4.11 Canny Elevator Co. Ltd.
- 6.4.12 Johnson Lifts Pvt Ltd.
- 6.4.13 Orona S. Coop.
- 6.4.14 Wittur Group
- 6.4.15 Kleemann Hellas
- 6.4.16 Stannah Lifts Holdings Ltd.
- 6.4.17 Eita Elevator (M) Sdn Bhd
- 6.4.18 Gulf Elevator & Escalator Co.
- 6.4.19 Alpine Elevator Co.
- 6.4.20 Savaria Corporation
- 6.4.21 Hitachi-Yungtay Elevator (Taiwan)
7 Market Opportunities & Future Outlook
- 7.1 White-space & Unmet-need Assessment

