
PUBLISHER: Mordor Intelligence | PRODUCT CODE: 2066748

PUBLISHER: Mordor Intelligence | PRODUCT CODE: 2066748
Decentralized Finance (DeFi) - Market Share Analysis, Industry Trends & Statistics, Growth Forecasts (2026 - 2031)
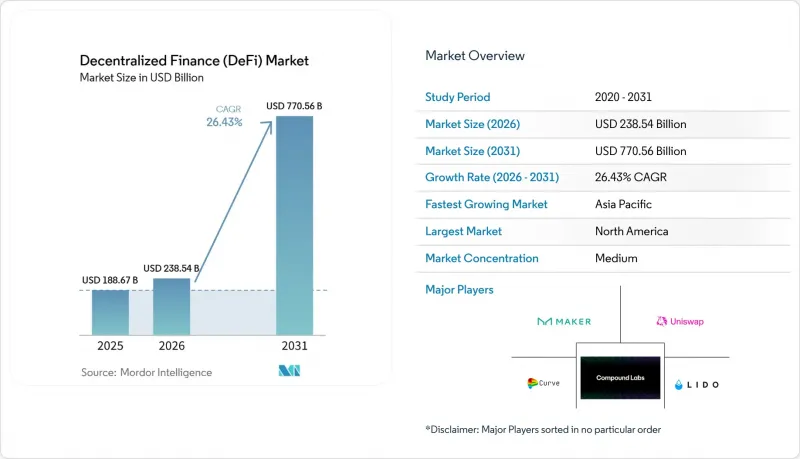
According to Mordor Intelligence, the decentralized finance market size is projected to expand from USD 188.67 billion in 2025 and USD 238.54 billion in 2026 to USD 770.56 billion by 2031, registering a CAGR of 26.43% between 2026 to 2031.
This report is Segmented by Protocol Type (Decentralized Exchanges (DEX), Lending & Borrowing Protocols, and More), End-Use Application (Payments, Remittances & Cross-Border Treasury, and More), End User (Retail Users, Small & Medium Enterprises (SMEs), and More), and Geography (North America, South America, and More). The Market Forecasts are Provided in Terms of Value (USD).
Global Decentralized Finance (DeFi) Market Trends and Insights
Rising Total-Value-Locked Across Core DeFi Verticals
Liquidity depth on leading chains and exchanges supports more efficient pricing, routing, and collateral management as the DeFi market attracts users seeking reliable execution and audited code paths. High and sustained stablecoin transfer volumes, alongside growth in Layer-2 activity, point to a structural shift from episodic speculation to continuous settlement utility that feeds protocol revenue and long-term user retention. As capital consolidates on platforms with stronger governance and security, the market benefits from lower slippage and tighter spreads under normal conditions. International bodies have noted that rising interlinkages also transmit stress more quickly across venues, which increases the value of rigorous risk controls and diversified oracle sources. The net effect is a market structure where depth, speed, and composability support growth while requiring consistent attention to systemic risk and transparency across major liquidity pools.
Regulatory Clarity in the United States (ETF) & the EU (MiCA) Unlocks Institutional Flows
The approval of spot Bitcoin exchange-traded products created a regulated wrapper that traditional allocators can use under existing policies, which reduces operational friction for exposure that often interacts downstream with DeFi liquidity venues. MiCA outlines authorization pathways for crypto-asset service providers and establishes reserve and disclosure requirements for asset-referenced and e-money tokens, enhancing passportability and reducing regulatory uncertainty for compliant issuers and intermediaries across the bloc. Payment-network pilots for stablecoin settlement now operate within bank-partner models that align with core reconciliation and dispute processes, a development that ties the DeFi market to mainstream acceptance infrastructure. United States banking and trust structures for digital assets further move custody and settlement inside prudential oversight, which helps large institutions meet supervisory expectations while participating in tokenized finance. Together, these frameworks lower perceived compliance risk, enable scaled product rollouts, and shift capital from pilot programs to production deployments across North America and Europe, with spillover to Asia-Pacific hubs that align with similar rules.
Smart-Contract Exploits & Oracle Manipulation Risk
Security incidents and logic flaws can drain funds or disrupt price discovery, which affects confidence, slows onboarding, and raises the cost of capital for new deployments in the DeFi market. Composability amplifies both benefits and risks, since a single faulty contract or price feed can propagate across lending, trading, and collateral management within minutes. International bodies have flagged the centralization of certain operational controls as a point of failure that can undermine claims of decentralization when governance and upgrades concentrate among a few actors. This pattern increases the premium on formal verification, multifactor upgrade paths, and layered oracle designs with diversified data sources. As institutional participation grows, the market will need stronger assurance controls and documented incident response to meet the expectations associated with prudential oversight.
Other drivers and restraints analyzed in the detailed report include:
- Layer-2 Fee Compression Expands Viable Use-Cases
- Tokenized Real-World-Asset (RWA) Platforms Gain Banking-Grade Traction
- Targeted Regulatory Actions on Leverage and Derivatives Create Uncertainty
For complete list of drivers and restraints, kindly check the Table Of Contents.
Segment Analysis
Lending & Borrowing Protocols captured 27.33% share in 2025, while Tokenized RWA Platforms are projected to expand at a 39.72% CAGR through 2031, setting a new growth baseline for capital that needs compliant issuance, custody, and reporting. Tokenization of money market exposures and fixed income instruments under established investor protections is creating an on-ramp for asset managers and treasurers to tap on-chain liquidity without compromising on governance and controls. Issuers that pair transparent reserves with permissioned access and standardized attestations can streamline reconciliation and reduce operational friction, which strengthens the case for token-based administration at scale. The DeFi market is seeing RWA platforms serve as connective tissue between regulated assets and decentralized settlement as they embed policy requirements into code and process design. As a result, lending protocols remain an anchor for collateral and yield, while RWA rails capture the fastest growth by unlocking product formats that fit within traditional mandates.
Exchanges continue to drive price discovery and volume concentration, and their evolution toward fee-based value accrual reflects a wider shift away from incentive-heavy models in the DeFi market. Market-share leadership among a few DEXs delivers liquidity benefits that also heighten the need for robust oracles and transparent parameter governance. Layer-2 fee compression creates room for more active liquidity management and smaller trade sizes, which expands the user base across retail and institutions. Stablecoin issuance aligned with disclosure and reserve rules benefits from payments integration and bank partnerships, which pull traditional workflows closer to on-chain rails. Over the forecast window, the DeFi market will likely see protocol differentiation around compliance readiness, permissioned pools, and institutional reporting, with RWA platforms anchoring the fastest-expanding layer.
Geography Analysis
North America accounted for 42.78% in 2025, supported by regulated ETF access, custody expansion, and early payment-network pilots that connect bank partners with tokenized settlement in the DeFi market. ETF approvals created a familiar product format that institutions could incorporate under existing policy and disclosure regimes, which accelerated flows into regulated channels. Banking and trust charters for digital assets moved settlement and custody inside prudential oversight, which aligns DeFi interactions with supervisory expectations and risk controls. In parallel, stablecoin settlement pilots demonstrated how merchant acceptance, reconciliation, and dispute management can operate with programmable assets, which pulls more treasury activity toward the DeFi market. This mix of product access, oversight, and payments utility explains why North America maintains a leading position while creating a template that other regions adapt within their legal context.
Europe's share reflects a rules-based approach that codifies authorization, reserve, and disclosure requirements under MiCA, which improves passportability for issuers, custodians, and exchanges that serve the DeFi market. The combination of e-money alignment and transfer-of-funds obligations brings identity and traceability into the crypto transfer process, which favours providers that can meet operational standards across member states. Banks experimenting with euro-denominated settlement tokens and tokenized instruments demonstrate how the region is integrating decentralized components with established financial plumbing. Over the forecast period, Europe's contribution will hinge on how quickly MiCA-aligned providers scale across borders and expand listings and custody within the market. The emphasis on disclosure, reserves, and operational resilience positions the region for steady, policy-led growth rather than speculative cycles.
Asia-Pacific is projected to grow at a 31.89% CAGR through 2031 as regulatory hubs implement stablecoin rules and tokenized-deposit pilots that enable compliant participation in the DeFi market. Regional policy changes, including frameworks for blockchain-based funds and payments, are drawing activity into supervised channels that interoperate with bank-grade infrastructure. Payment-network pilots and wallet-bank integrations support cross-border commerce and remittances, which creates practical demand for stablecoins within regulated corridors. As connectivity improves across banks, custodians, and exchanges, liquidity will continue to diversify across chains and rollups while maintaining access to compliant issuers and venues in the DeFi market. The region's growth path reflects a balance of regulatory experimentation in hubs and strong enterprise demand for programmable settlement that is consistent with local rules.
- MakerDAO
- Uniswap Labs
- Curve Finance
- Lido Finance
- Compound Labs
- Synthetix
- ConsenSys
- Circle Internet Financial
- Tether Operations
- Binance Labs
- Solana Foundation
- Tron DAO
- StarkWare
- Polygon Labs
- Coinbase (Base)
- Centrifuge
- Maple Finance
- Pendle Finance
- Morpho Labs
- Hyperliquid
Additional Benefits:
- The market estimate (ME) sheet in Excel format
- 3 months of analyst support
TABLE OF CONTENTS
1 Introduction
- 1.1 Study Assumptions & Market Definition
- 1.2 Scope of the Study
2 Research Methodology
3 Executive Summary
4 Market Landscape
- 4.1 Market Overview
- 4.2 Market Drivers
- 4.2.1 Rising Total-Value-Locked across core DeFi verticals
- 4.2.2 Regulatory clarity in United States (ETF) & EU (MiCA) unlocks institutional flows
- 4.2.3 Layer-2 fee compression expands viable use-cases
- 4.2.4 Tokenized real-world-asset (RWA) platforms gain banking-grade traction
- 4.2.5 Emerging AI-driven "DeFAI" robo-agents automate yield strategies
- 4.2.6 Payment-network integrations bridge mainstream rails with DeFi
- 4.3 Market Restraints
- 4.3.1 Smart-contract exploits & oracle manipulation risk
- 4.3.2 AML / KYC enforcement actions on non-compliant dApps
- 4.3.3 Liquidity concentration on a handful of pools elevates systemic risk
- 4.3.4 Targeted regulatory actions on leverage and derivatives create uncertainty
- 4.4 Value Chain Analysis
- 4.5 Regulatory Landscape
- 4.6 Technological Outlook
- 4.7 Porter's Five Forces
- 4.7.1 Threat of New Entrants
- 4.7.2 Threat of Substitutes
- 4.7.3 Bargaining Power of Buyers
- 4.7.4 Bargaining Power of Suppliers
- 4.7.5 Degree of Competition
5 Market Size & Growth Forecasts
- 5.1 By Protocol Type
- 5.1.1 Decentralized Exchanges (DEX)
- 5.1.2 Lending & Borrowing Protocols
- 5.1.3 Stablecoin Issuance Platforms
- 5.1.4 Tokenized RWA Platforms
- 5.1.5 Others (Derivatives, Yield Aggregators, Liquid Staking, etc.)
- 5.2 By End-Use Application
- 5.2.1 Payments, Remittances & Cross-Border Treasury
- 5.2.2 Trading & Investment
- 5.2.3 Savings & Yield Farming
- 5.2.4 Others (Insurance, Infrastructure, GameFi)
- 5.3 By End User
- 5.3.1 Retail Users
- 5.3.2 Small & Medium Enterprises (SMEs)
- 5.3.3 Large Enterprises
- 5.3.4 Institutional Investors & Asset Managers
- 5.4 By Geography
- 5.4.1 North America
- 5.4.1.1 Canada
- 5.4.1.2 United States
- 5.4.1.3 Mexico
- 5.4.2 South America
- 5.4.2.1 Brazil
- 5.4.2.2 Peru
- 5.4.2.3 Chile
- 5.4.2.4 Argentina
- 5.4.2.5 Rest of South America
- 5.4.3 Europe
- 5.4.3.1 United Kingdom
- 5.4.3.2 Germany
- 5.4.3.3 France
- 5.4.3.4 Spain
- 5.4.3.5 Italy
- 5.4.3.6 BENELUX (Belgium, Netherlands, Luxembourg)
- 5.4.3.7 NORDICS (Denmark, Finland, Iceland, Norway, Sweden)
- 5.4.3.8 Rest of Europe
- 5.4.4 Asia-Pacific
- 5.4.4.1 India
- 5.4.4.2 China
- 5.4.4.3 Japan
- 5.4.4.4 Australia
- 5.4.4.5 South Korea
- 5.4.4.6 South East Asia (Singapore, Malaysia, Thailand, Indonesia, Vietnam, and Philippines)
- 5.4.4.7 Rest of Asia-Pacific
- 5.4.5 Middle East and Africa
- 5.4.5.1 United Arab Emirates
- 5.4.5.2 Saudi Arabia
- 5.4.5.3 South Africa
- 5.4.5.4 Nigeria
- 5.4.5.5 Rest of Middle East and Africa
- 5.4.1 North America
6 Competitive Landscape
- 6.1 Market Concentration
- 6.2 Strategic Moves
- 6.3 Market Share Analysis
- 6.4 Company Profiles (includes Global level Overview, Market level overview, Core Segments, Financials as available, Strategic Information, Market Rank/Share for key companies, Products & Services, and Recent Developments)
- 6.4.1 MakerDAO
- 6.4.2 Uniswap Labs
- 6.4.3 Curve Finance
- 6.4.4 Lido Finance
- 6.4.5 Compound Labs
- 6.4.6 Synthetix
- 6.4.7 ConsenSys
- 6.4.8 Circle Internet Financial
- 6.4.9 Tether Operations
- 6.4.10 Binance Labs
- 6.4.11 Solana Foundation
- 6.4.12 Tron DAO
- 6.4.13 StarkWare
- 6.4.14 Polygon Labs
- 6.4.15 Coinbase (Base)
- 6.4.16 Centrifuge
- 6.4.17 Maple Finance
- 6.4.18 Pendle Finance
- 6.4.19 Morpho Labs
- 6.4.20 Hyperliquid
7 Market Opportunities & Future Outlook
- 7.1 White-space & Unmet-Need Assessment

