
PUBLISHER: Mordor Intelligence | PRODUCT CODE: 2072485

PUBLISHER: Mordor Intelligence | PRODUCT CODE: 2072485
United States Homeowners Insurance - Market Share Analysis, Industry Trends & Statistics, Growth Forecasts (2026 - 2031)
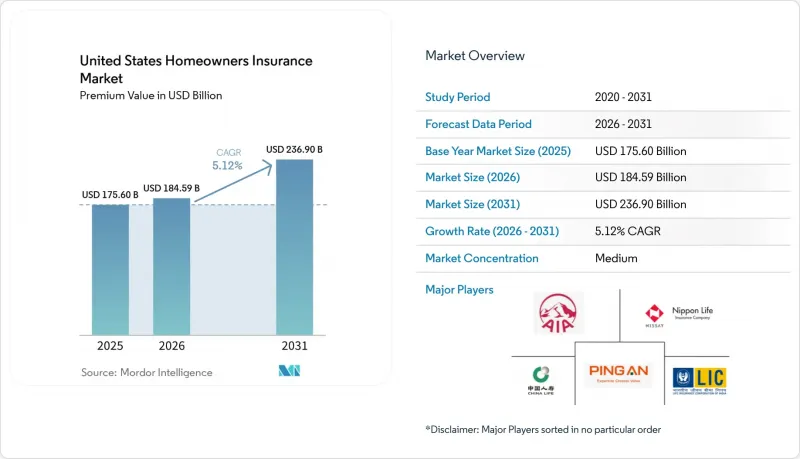
According to Mordor Intelligence, the united states homeowners insurance market size in terms of premium value is projected to expand from USD 175.60 billion in 2025 and USD 184.59 billion in 2026 to USD 236.90 billion by 2031, registering a CAGR of 5.12% between 2026 to 2031.
This report is Segmented by Insurance Type (Dwelling Fire, HO-1, HO-2, HO-3, HO-5, HO-8) and Distribution Channel (Brokers/Agents, Banks, Direct Sales, Other Channels). The Market Forecasts are Provided in Terms of Value (USD Billion).
United States Homeowners Insurance Market Trends and Insights
Mandatory Mortgage-Linked Insurance Demand
Lender requirements keep the United States homeowners insurance market anchored, since mortgage servicers mandate continuous dwelling coverage for financed homes regardless of price cycles. This structural effect is significant given that a majority of owner-occupied households carry mortgage debt, with the homeownership rate measuring 65.3% in Q3 2025 and the owner-occupied base near 87 million households. Policy availability tightens in catastrophe-prone areas, yet residual mechanisms and excess-and-surplus channels sustain access to coverage, helping stabilize policy counts even when prices rise. The 2024 return to underwriting profit demonstrates how rate adequacy and disciplined capacity management can offset volatility, while mortgage-linked inelasticity limits lapse risk in the core financed segment. As a result, the United States homeowners insurance market continues to exhibit stable baseline demand in 2026, even as risk selection and pricing sharpen in high-exposure territories.
Rising Residential Property Valuations
Home price appreciation feeds premium growth as insurers recalibrate coverage limits through inflation guard provisions and at renewal or property transfer. Elevated replacement cost inflation compounds the effect, with industry analysis reporting a multi-year spike in reconstruction costs that pushed coverage amounts higher through 2025. Owners' monthly housing costs for mortgaged properties reached USD 2,035 in 2024, confirming the pressure that insurance and financing costs together place on household budgets. These valuation and cost trends ensure that the United States homeowners insurance market continues to capture higher insured values even when underlying transaction volumes fluctuate. The combined impact lifts premium bases while making coverage adequacy reviews a regular feature of annual renewals in 2026.
Escalating Climate and Catastrophe Exposure
Catastrophe frequency and severity raise loss volatility and constrain risk appetites in exposed geographies, which weighs on growth. The United States recorded 27 billion-dollar disaster events in 2024, with insured losses totaling USD 110 billion, reflecting persistent increases in weather-related risk. H1 2025 performance showed direct losses incurred up 30.9% year over year and a pure direct loss ratio of 78.7%, which offset some of the rate adequacy carriers built in 2024. Treasury analysis highlights the gradient in high-risk ZIP codes, where premiums and nonrenewals have been higher alongside elevated claim costs and loss ratios. This exposure dynamic remains a structural constraint on the United States homeowners insurance market in 2026 and informs underwriting, reinsurance, and geographic portfolio decisions.
Other drivers and restraints analyzed in the detailed report include:
- Expansive and Diversified Housing Stock
- Supportive State-Level Regulatory Environment
- Affordability Pressure from Premium Inflation
For complete list of drivers and restraints, kindly check the Table Of Contents.
Segment Analysis
The HO-3 Special Form holds 63.50% of the United States homeowners insurance market share in 2025, with a projected 7.84% CAGR growth through 2031. Its broad dwelling protection, priced to meet mortgage requirements, makes it the default choice for standard owner-occupied risks in 2026. The HO-5 form, designed for higher-value, coverage-sensitive households, is gaining exposure as demand for broader coverage and higher limits rises, according to recent NAIC data. HO-1 and HO-2 forms are shrinking, serving niche markets where property conditions or underwriting criteria limit broader options. This reinforces a two-tiered product structure dominated by HO-3 and premium HO-5 coverage. The HO-8 form, suitable for older properties where replacement costs are impractical, is declining as renovations modernize dwellings.
Policy exposures and coverage bands support this segmentation. NAIC data show a focus on mid-range dwelling limits, aligning with median property values and underwriting risk appetite. Technology-driven underwriting, including image analytics, enhances risk selection, improves HO-3 pricing adequacy, and enables HO-5 to justify surcharges for broader coverage. By 2026, form-level differentiation bridges consumer budget constraints with coverage needs for resilient rebuilds after severe weather. These dynamics continue to guide product design decisions in the United States homeowners insurance market.
Complete Report Scope:
- By Insurance Type
- Dwelling Fire
- HO-1
- HO-2
- HO-3
- HO-5
- HO-8
- By Distribution Channel
- Brokers/Agents
- Banks
- Direct Sales
- Other Channels
List of Companies Covered in this Report:
- AIA Group
- Nippon Life Group
- Life Insurance Corporation of India (LIC)
- China Life Insurance Group
- Ping An Insurance Group
- Prudential plc
- Manulife Financial Group
- Dai-ichi Life Group
- Meiji Yasuda Life Group
- Tokio Marine Group
- MS&AD Insurance Group
- Samsung Life Insurance Group
- HDFC Life Group
- Sun Life Financial Group
- HSBC Life Group
- Aviva Group
- TAL Group
- AMP Group
- Muang Thai Life Assurance Group
- Hong Leong Financial Group
Additional Benefits:
- The market estimate (ME) sheet in Excel format
- 3 months of analyst support
TABLE OF CONTENTS
1 Introduction
- 1.1 Study Assumptions & Market Definition
- 1.2 Scope of the Study
2 Research Methodology
3 Executive Summary
4 Market Landscape
- 4.1 Market Overview
- 4.2 Market Drivers
- 4.2.1 Mandatory mortgage-linked insurance demand
- 4.2.2 Rising residential property valuations
- 4.2.3 Expansive and diversified housing stock
- 4.2.4 Supportive state-level regulatory environment
- 4.2.5 Digitalization of policy distribution and servicing
- 4.2.6 Sustained homeownership base
- 4.3 Market Restraints
- 4.3.1 Escalating climate and catastrophe exposure
- 4.3.2 Affordability pressure from premium inflation
- 4.3.3 Coverage withdrawal in high-risk geographies
- 4.3.4 Rate approval delays and regulatory constraints
- 4.4 Macroeconomic & Industry Indicators Impacting the Market
- 4.5 Technology Analysis
- 4.6 Industry Value Chain Analysis
- 4.7 Porter's Five Forces Analysis
- 4.7.1 Threat of New Entrants
- 4.7.2 Bargaining Power of Suppliers
- 4.7.3 Bargaining Power of Buyers
- 4.7.4 Threat of Substitutes
- 4.7.5 Competitive Rivalry
5 Market Size & Growth Forecasts (Value)
- 5.1 By Insurance Type
- 5.1.1 Dwelling Fire
- 5.1.2 HO-1
- 5.1.3 HO-2
- 5.1.4 HO-3
- 5.1.5 HO-5
- 5.1.6 HO-8
- 5.2 By Distribution Channel
- 5.2.1 Brokers/Agents
- 5.2.2 Banks
- 5.2.3 Direct Sales
- 5.2.4 Other Channels
6 Competitive Landscape
- 6.1 Market Concentration
- 6.2 Strategic Moves
- 6.3 Market Share Analysis
- 6.4 Company Profiles (includes Global level Overview, Market level overview, Core Segments, Financials as available, Strategic Information, Market Rank/Share for key companies, Products & Services, and Recent Developments)
- 6.4.1 AIA Group
- 6.4.2 Nippon Life Group
- 6.4.3 Life Insurance Corporation of India (LIC)
- 6.4.4 China Life Insurance Group
- 6.4.5 Ping An Insurance Group
- 6.4.6 Prudential plc
- 6.4.7 Manulife Financial Group
- 6.4.8 Dai-ichi Life Group
- 6.4.9 Meiji Yasuda Life Group
- 6.4.10 Tokio Marine Group
- 6.4.11 MS&AD Insurance Group
- 6.4.12 Samsung Life Insurance Group
- 6.4.13 HDFC Life Group
- 6.4.14 Sun Life Financial Group
- 6.4.15 HSBC Life Group
- 6.4.16 Aviva Group
- 6.4.17 TAL Group
- 6.4.18 AMP Group
- 6.4.19 Muang Thai Life Assurance Group
- 6.4.20 Hong Leong Financial Group
7 Market Opportunities & Future Outlook

