PUBLISHER: Mordor Intelligence | PRODUCT CODE: 2073003

PUBLISHER: Mordor Intelligence | PRODUCT CODE: 2073003
Ovarian Cancer Drugs - Market Share Analysis, Industry Trends & Statistics, Growth Forecasts (2026 - 2031)
According to Mordor Intelligence, the ovarian cancer drugs market size is expected to grow from USD 4.73 billion in 2025 to USD 5.14 billion in 2026 and is forecast to reach USD 8.09 billion by 2031 at 9.49% CAGR over 2026-2031.
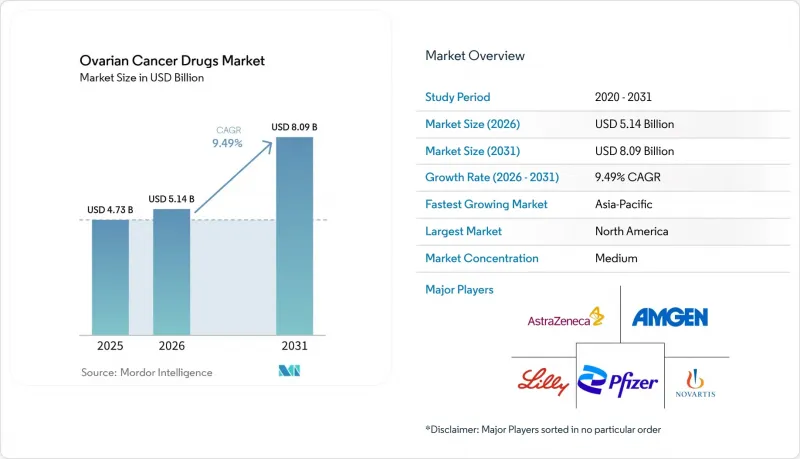
This report is Segmented by Tumor Type (Epithelial, Germ Cell, Stromal Cell), Drug Type (Alkylating Agents, Mitotic Inhibitors, VEGF/VEGFR Inhibitors, PARP Inhibitors, Other), Distribution Channel (Hospital Pharmacies, Drug Stores, Other), End User (Hospitals, and More), and Geography (North America, Europe, Asia-Pacific, MEA, South America). The Market Forecasts are Provided in Terms of Value (USD).
Global Ovarian Cancer Drugs Market Trends and Insights
Rising BRCA and HRD-Guided PARP Inhibitor Use
The ovarian cancer drugs market continues to benefit from broader HRD-linked treatment eligibility in frontline and maintenance settings. FDA clearance of MyChoice CDx for niraparib in March 2026 strengthened the diagnostic basis for selecting HRD-positive patients and raised the number of patients who can be identified for PARP therapy under formal testing workflows. Long-run survival evidence has also kept PARP inhibitors central to treatment planning for BRCA-mutated disease, especially where maintenance therapy is established in routine care. At the same time, resistance research is showing that patient selection alone will not determine future uptake because treatment sequencing and prior chemotherapy exposure can influence later PARP response. That makes the ovarian cancer drugs market more dependent on how physicians combine biomarker data with line-of-therapy decisions. It also supports continued investment in diagnostic depth, sequencing strategy, and follow-up evidence for long-duration maintenance use.
Expansion of FRa-Targeted ADC Adoption in Platinum-Resistant Disease
The ovarian cancer drugs market is gaining a new growth layer from FRa-targeted antibody drug conjugates in platinum-resistant disease. Stronger survival evidence for mirvetuximab soravtansine has reinforced the role of FRa-directed treatment in a setting that previously had few differentiated options with durable benefit. This matters because platinum-resistant disease carries a high unmet need and often drives rapid adoption when a therapy shows both clinical activity and clearer patient selection. The ovarian cancer drugs market is also showing that reimbursement and health technology assessment now shape uptake as much as trial data, especially when premium-priced biologics move from approval to funded access. That raises the commercial importance of value demonstration after approval, particularly in systems where survival and quality-of-life evidence guide access. It also means developers with targeted assets need pricing flexibility, biomarker clarity, and region-specific access planning to scale volume.
Rapid Emergence of PARP Resistance and Cross-Resistance
The ovarian cancer drugs market faces a clear growth constraint from faster characterization of PARP resistance mechanisms. Recent research identified multiple resistance pathways, including homologous recombination repair restoration, replication fork stabilization, and drug efflux changes, which means resistance is now better defined and harder to ignore in treatment planning. Additional work has also shown that PARP inhibitor-resistant tumors may develop distinct biological vulnerabilities, which confirms that resistance is not a single event and cannot be managed with a uniform response. Commercially, this reduces the number of effective lines available for the same drug class and limits the duration of revenue that each patient can generate. The ovarian cancer drugs market is therefore being pushed toward next-generation assets and better-defined sequencing logic rather than repeat use of the same class after progression. That pressure also increases the value of companion biomarkers and real-world monitoring tools that can identify which patients still benefit from continued targeted treatment.
Other drivers and restraints analyzed in the detailed report include:
- Earlier-Line Use of Maintenance Combination Regimens
- Broader Molecular Testing and Companion Diagnostics Access
- High Annual Therapy Cost and Reimbursement Pressure
For complete list of drivers and restraints, kindly check the Table Of Contents.
Segment Analysis
Epithelial ovarian cancer held 63.21% of revenue in 2025 and remained the largest tumor type in the ovarian cancer drugs market. This concentration reflects the clinical weight of high-grade serous disease across induction, maintenance, and relapse treatment pathways. Epithelial tumors also carry the largest share of BRCA-mutated and HRD-positive patients, which keeps precision therapies most relevant in this segment. As a result, the ovarian cancer drugs industry continues to direct most commercial and clinical effort toward epithelial disease. This concentration also gives drug makers a clearer route to scale because testing, treatment algorithms, and evidence generation are all more mature in this setting.
Germ cell ovarian cancer is projected to grow at a 9.81% CAGR through 2031, making it the fastest-growing tumor type sub-segment in the ovarian cancer drugs market. Growth here is tied less to current volume and more to improved molecular characterization of rare subtypes that were historically treated with broader chemotherapy approaches. Targetable findings in dysgerminoma and related tumors are supporting incremental use of more precise treatments, even though chemotherapy still delivers strong responses in many patients. Stromal tumors are also drawing attention because their hormone-linked biology creates room for more specialized development paths. The ovarian cancer drugs industry is therefore widening beyond epithelial disease, but these rare subtypes remain smaller commercial opportunities that depend heavily on testing depth, referral patterns, and specialist center adoption.
PARP inhibitors held 42.83% of revenue in 2025, which gave them the leading position in the ovarian cancer drugs market share by drug type. Their strength comes from established use in first-line maintenance, clear biomarker links, and long follow-up data that continue to support benefit in selected patients. Companion diagnostic progress has also reinforced this class by improving patient identification and keeping prescribing tied to formal testing pathways. That combination of label breadth and diagnostic support keeps PARP inhibitors central to the ovarian cancer drugs market even as resistance pressures rise. Older cytotoxic classes still matter clinically, but they offer less room for pricing power or product differentiation because most value has shifted toward targeted therapy.
VEGF and VEGFR inhibitors are projected to grow at an 11.43% CAGR through 2031, giving them the fastest expansion profile among drug classes in the ovarian cancer drugs market size mix. Their outlook is supported by broader use of bevacizumab combinations, rising access to lower-cost versions in price-sensitive regions, and pipeline activity around new antiangiogenic combinations. This class benefits from relevance across multiple treatment stages rather than a narrow single indication. Other drug types, including ADCs and immunotherapy-led regimens, are also adding momentum, but they remain more fragmented by mechanism and patient selection. Over the forecast period, the ovarian cancer drugs market is likely to reward drug classes that combine broader eligibility with manageable evidence, access, and toxicity burdens.
Complete Report Scope:
- By Tumor Type
- Epithelial Ovarian Cancer
- Serous Carcinoma
- Endometrioid Carcinoma
- Clear Cell Carcinoma
- Mucinous Carcinoma
- Germ Cell Ovarian Cancer
- Dysgerminoma
- Yolk Sac Tumor
- Teratoma
- Embryonal Carcinoma
- Stromal Cell Ovarian Cancer
- Granulosa Cell Tumor
- Sertoli-Leydig Cell Tumor
- Thecoma
- Fibroma
- Epithelial Ovarian Cancer
- By Drug Type
- Alkylating Agents
- Mitotic Inhibitors
- VEGF and VEGFR Inhibitors
- PARP Inhibitors
- Other Drug Types
- By Distribution Channel
- Hospital Pharmacies
- Drug Stores
- Other Distribution Channels
- By End User
- Hospitals
- Oncology Clinics
- Specialty Cancer Centers
- Research Institutes
- By Geography
- North America
- United States
- Canada
- Mexico
- Europe
- Germany
- United Kingdom
- France
- Italy
- Spain
- Rest of Europe
- Asia-Pacific
- China
- Japan
- India
- Australia
- South Korea
- Rest of Asia-Pacific
- Middle East & Africa
- GCC
- South Africa
- Rest of Middle East & Africa
- South America
- Brazil
- Argentina
- Rest of South America
- North America
Geography Analysis
North America held 39.41% of revenue in 2025 and remained the largest regional contributor to the ovarian cancer drugs market. The region benefits from dense clinical trial activity, wider use of BRCA and HRD testing, and a regulatory environment that often delivers earlier access to new therapies. The United States continues to act as the first major launch market for many ovarian therapies, which supports earlier revenue capture and stronger physician familiarity. This position also reinforces North America's role in setting treatment pathways that later influence adoption elsewhere.
Europe remained the second-largest regional block in the ovarian cancer drugs market, but access conditions vary sharply across countries. Regulatory coordination helps align approvals, yet reimbursement timing and health technology review still create uneven treatment availability. That matters because a therapy may be approved across Europe but still reach patients at different speeds depending on local funding decisions. The ovarian cancer drugs market therefore expands more slowly in Europe than its clinical innovation would suggest, especially for high-cost therapies that need stronger value arguments.
Asia-Pacific is projected to expand at an 11.26% CAGR through 2031 and is the fastest-growing regional segment in the ovarian cancer drugs market size outlook. China is central to that growth because reimbursement support for multiple PARP inhibitors and broader molecular testing infrastructure are improving practical access. Domestic manufacturing and biosimilar competition are also likely to expand the use of antiangiogenic therapy while lowering realized pricing in some channels. Japan and South Korea add momentum through strong oncology centers, structured testing pathways, and high participation in specialist care. The ovarian cancer drugs market is also broadening gradually in the Middle East and Africa as governments invest in oncology capacity. South America remains more selective in access, with stronger bevacizumab uptake than PARP penetration because affordability and advanced biomarker testing still limit broader targeted therapy use.
- Abbvie
- Amgen
- AstraZeneca
- BeiGene, Ltd.
- Bristol-Myers Squibb
- Clovis Oncology, Inc.
- Daiichi Sankyo
- Eisai
- Eli Lilly and Company
- Roche
- Genmab
- GlaxoSmithKline
- Innovent Biologics, Inc.
- Jiangsu Hengrui Medicine Co., Ltd.
- Johnson & Johnson
- Merck
- Novartis
- Pfizer
- Pharma Mar, S.A.
- Verastem, Inc.
- Zai Lab Limited
Additional Benefits:
- The market estimate (ME) sheet in Excel format
- 3 months of analyst support
TABLE OF CONTENTS
1 Introduction
- 1.1 Study Assumptions & Market Definition
- 1.2 Scope of the Study
2 Research Methodology
3 Executive Summary
4 Market Landscape
- 4.1 Market Overview
- 4.2 Market Drivers
- 4.2.1 Rising BRCA and HRD-Guided PARP Inhibitor Use
- 4.2.2 Expansion of FRa-Targeted ADC Adoption in Platinum-Resistant Disease
- 4.2.3 Earlier-Line Use of Maintenance Combination Regimens
- 4.2.4 Broader Molecular Testing and Companion Diagnostics Access
- 4.2.5 Pipeline Readouts in KRAS-Mutant, CCNE1-Amplified, and Rare Subtypes
- 4.2.6 Real-World Evidence Support for Sequencing After First PARP Exposure
- 4.3 Market Restraints
- 4.3.1 Rapid Emergence of PARP Resistance and Cross-Resistance
- 4.3.2 High Annual Therapy Cost and Reimbursement Pressure
- 4.3.3 Biomarker Fragmentation Shrinking Eligible Patient Pools
- 4.3.4 Hematologic and Ocular Toxicity Limiting Long-Term Use
- 4.4 Value / Supply-Chain Analysis
- 4.5 Regulatory Landscape
- 4.6 Technological Outlook
- 4.7 Porter's Five Forces Analysis
- 4.7.1 Threat of New Entrants
- 4.7.2 Bargaining Power of Suppliers
- 4.7.3 Bargaining Power of Buyers
- 4.7.4 Threat of Substitutes
- 4.7.5 Industry Rivalry
5 Market Size & Growth Forecasts
- 5.1 By Tumor Type
- 5.1.1 Epithelial Ovarian Cancer
- 5.1.1.1 Serous Carcinoma
- 5.1.1.2 Endometrioid Carcinoma
- 5.1.1.3 Clear Cell Carcinoma
- 5.1.1.4 Mucinous Carcinoma
- 5.1.2 Germ Cell Ovarian Cancer
- 5.1.2.1 Dysgerminoma
- 5.1.2.2 Yolk Sac Tumor
- 5.1.2.3 Teratoma
- 5.1.2.4 Embryonal Carcinoma
- 5.1.3 Stromal Cell Ovarian Cancer
- 5.1.3.1 Granulosa Cell Tumor
- 5.1.3.2 Sertoli-Leydig Cell Tumor
- 5.1.3.3 Thecoma
- 5.1.3.4 Fibroma
- 5.1.1 Epithelial Ovarian Cancer
- 5.2 By Drug Type
- 5.2.1 Alkylating Agents
- 5.2.2 Mitotic Inhibitors
- 5.2.3 VEGF and VEGFR Inhibitors
- 5.2.4 PARP Inhibitors
- 5.2.5 Other Drug Types
- 5.3 By Distribution Channel
- 5.3.1 Hospital Pharmacies
- 5.3.2 Drug Stores
- 5.3.3 Other Distribution Channels
- 5.4 By End User
- 5.4.1 Hospitals
- 5.4.2 Oncology Clinics
- 5.4.3 Specialty Cancer Centers
- 5.4.4 Research Institutes
- 5.5 By Geography
- 5.5.1 North America
- 5.5.1.1 United States
- 5.5.1.2 Canada
- 5.5.1.3 Mexico
- 5.5.2 Europe
- 5.5.2.1 Germany
- 5.5.2.2 United Kingdom
- 5.5.2.3 France
- 5.5.2.4 Italy
- 5.5.2.5 Spain
- 5.5.2.6 Rest of Europe
- 5.5.3 Asia-Pacific
- 5.5.3.1 China
- 5.5.3.2 Japan
- 5.5.3.3 India
- 5.5.3.4 Australia
- 5.5.3.5 South Korea
- 5.5.3.6 Rest of Asia-Pacific
- 5.5.4 Middle East & Africa
- 5.5.4.1 GCC
- 5.5.4.2 South Africa
- 5.5.4.3 Rest of Middle East & Africa
- 5.5.5 South America
- 5.5.5.1 Brazil
- 5.5.5.2 Argentina
- 5.5.5.3 Rest of South America
- 5.5.1 North America
6 Competitive Landscape
- 6.1 Market Concentration
- 6.2 Market Share Analysis
- 6.3 Company Profiles (includes Global level Overview, Market-level Overview, Core Segments, Financials, Strategic Information, Market Rank/Share, Products & Services, Recent Developments)
- 6.3.1 AbbVie Inc.
- 6.3.2 Amgen Inc.
- 6.3.3 AstraZeneca plc
- 6.3.4 BeiGene, Ltd.
- 6.3.5 Bristol-Myers Squibb Company
- 6.3.6 Clovis Oncology, Inc.
- 6.3.7 Daiichi Sankyo Company, Limited
- 6.3.8 Eisai Co., Ltd.
- 6.3.9 Eli Lilly and Company
- 6.3.10 F. Hoffmann-La Roche Ltd.
- 6.3.11 Genmab A/S
- 6.3.12 GSK plc
- 6.3.13 Innovent Biologics, Inc.
- 6.3.14 Jiangsu Hengrui Medicine Co., Ltd.
- 6.3.15 Johnson and Johnson
- 6.3.16 Merck & Co., Inc.
- 6.3.17 Novartis AG
- 6.3.18 Pfizer Inc.
- 6.3.19 Pharma Mar, S.A.
- 6.3.20 Verastem, Inc.
- 6.3.21 Zai Lab Limited
7 Market Opportunities & Future Outlook
- 7.1 White-space & Unmet-need Assessment

