
PUBLISHER: Mordor Intelligence | PRODUCT CODE: 2073092

PUBLISHER: Mordor Intelligence | PRODUCT CODE: 2073092
Carbon-Aware Application Programming Interface (API) and Software Development Kit (SDK) Platform - Market Share Analysis, Industry Trends & Statistics, Growth Forecasts (2026 - 2031)
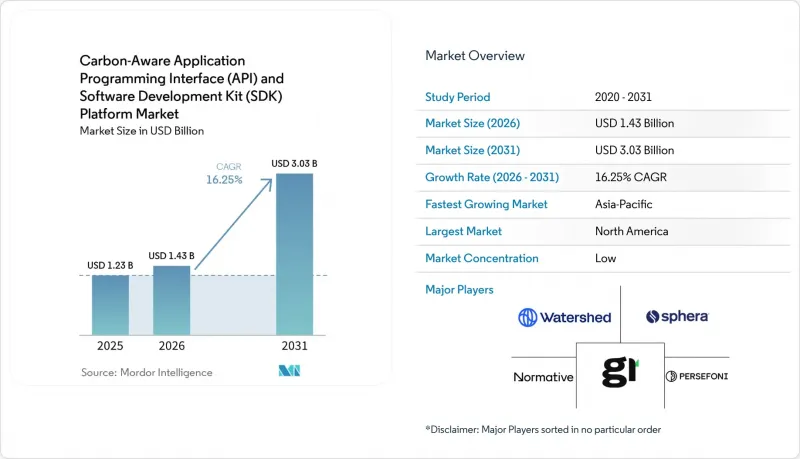
According to Mordor Intelligence, the carbon-aware application programming interface (API) and software development kit (SDK) platform market size is projected to be USD 1.23 billion in 2025, USD 1.43 billion in 2026, and reach USD 3.03 billion by 2031, growing at a CAGR of 16.25% from 2026 to 2031.
This report is Segmented by Component (Platform, and Services), Application (Carbon-Aware Kubernetes Scheduling, and More), Deployment Mode (Cloud-Based, and More), Organization Size (Large Enterprises, and More), End User (Retail and E-Commerce, and More), and Geography. The Market Forecasts are Provided in Terms of Value (USD).
Global Carbon-Aware Application Programming Interface (API) and Software Development Kit (SDK) Platform Market Trends and Insights
Increasing Audit-Ready Carbon Disclosure Requirements
The carbon-aware application programming interface (API) and software development kit (SDK) platform market is seeing its strongest commercial pull from mandatory disclosure frameworks that now require more traceable software emissions data. In 2026, many organizations across Europe are filing their first CSRD reports, and this process is raising pressure for structured, machine-readable emissions information that meets assurance requirements. The Software Carbon Intensity method maps software activity into a consistent reporting structure, which gives buyers a clearer way to request comparable carbon data from vendors and internal engineering teams. That shift matters because manual estimates are less useful when procurement teams seek application-level evidence rather than broad annual averages. The carbon-aware API and SDK platform market is therefore moving closer to core enterprise reporting infrastructure, especially for companies that sell software into Europe. State-level obligations, such as California SB 253, are adding a parallel reporting stream outside federal policy, which further broadens the compliance base addressed by these platforms.
AI and High-Performance Compute Workload Carbon Visibility
The carbon-aware application programming interface (API) and software development kit (SDK) platform market is also being driven by the rapid expansion of AI infrastructure and the need to measure its operating footprint with greater precision. Worldwide data center electricity use reached 448TWh in 2025, and current projections point to 945TWh by 2030, which keeps carbon visibility high on infrastructure roadmaps. The mix of energy demand is also changing because inference accounts for 80-90% of total AI energy consumption, so the measurement problem now sits in live production environments rather than only in model training labs. The Green Software Foundation ratified SCI for AI in late 2025, providing developers with a standard way to evaluate per-inference-request carbon intensity across GPU-heavy workloads. Peer-reviewed research also showed that carbon-aware AI scheduling can cut carbon use by up to 41% while keeping latency increases within 1.1-1.7%, which weakens the argument that lower emissions must come with a material performance penalty. As a result, the carbon-aware API and SDK platform market is gaining greater prominence in AI operations stacks where teams need both visibility and control.
Fragmented Carbon Signal Data Quality across Providers
The carbon-aware application programming interface (API) and software development kit (SDK) platform market still faces a major deployment barrier due to uneven data quality across carbon signal providers and regions. Coverage gaps are most visible in parts of South and Southeast Asia, Sub-Saharan Africa, and South America, where real-time marginal emissions data are limited or absent, forcing buyers to fall back on weaker annual-average proxies. Even in mature markets, the difference between average and marginal emissions intensity can lead to materially different scheduling decisions, especially in grids with high renewable penetration. WattTime and REsurety launched a free global Grid Emissions Data platform in March 2025, which improved access to hourly marginal data for qualified users but did not fully address real-time forecast quality in constrained regions. Buyers are therefore still exposed to methodology risk when they compare vendors that appear to address the same use case but differ in their underlying assumptions. This limits the pace at which the carbon-aware API and SDK platform market can move from targeted deployments to broader enterprise standardization.
Other drivers and restraints analyzed in the detailed report include:
- FinOps and Carbon Cost Co-Optimization
- Carbon Intensity API Adoption for Runtime Scheduling
- Integration Burden Across Cloud, DevOps, and Application Stacks
For complete list of drivers and restraints, kindly check the Table Of Contents.
Segment Analysis
Platform solutions held 62.51% of the carbon-aware application programming interface (API) and software development kit (SDK) market in 2025, making the integrated delivery model the preferred choice for early enterprise adoption. Buyers favored bundled platforms because they reduce the work needed to connect API management, carbon signal normalization, and reporting dashboards across multiple teams. This preference was strongest among large organizations that could justify higher license costs in exchange for faster time-to-value and lower integration effort. Early adoption also leaned toward technically mature customers, such as hyperscalers, global banks, and large technology firms, that already had strong internal platform engineering capabilities. In that context, the carbon-aware API and SDK platform market rewarded vendors that could deliver a managed operating environment rather than a narrow point tool.
Services are projected to expand at a 18.15% CAGR through 2031, indicating that tooling alone is not enough for many new buyers. The next wave of customers includes organizations that need help translating ISO-compliant software carbon methods into client-specific pipelines and operating policies. Amadeus transferred Carmen, its production-grade carbon measurement engine, to the Green Software Foundation in January 2026, which signals that core measurement tooling is becoming easier to access while implementation expertise remains commercially valuable. The carbon-aware application programming interface (API) and software development kit (SDK) platform industry is therefore moving toward a model where license revenue and services revenue reinforce each other rather than compete.
Carbon intensity APIs accounted for 54.23% of the carbon-aware application programming interface (API) and software development kit (SDK) platform market in 2025, reflecting their role as the primary data layer for downstream scheduling and reporting tools. This position is structural rather than temporary because most other application categories still depend on a reliable stream of carbon-intensity data before any optimization can happen. Carbon-aware Kubernetes scheduling and CI/CD workflow integration are already meaningful use cases, but they remain more fragmented because deployment logic changes across clouds, clusters, and software delivery practices. The carbon-aware API and SDK platform market, therefore, continues to center on the data layer that feeds all other application behavior. Vendors with dependable signal quality and strong normalization capabilities remain closer to the center of buyer decision-making than those that offer only narrower orchestration features.
AI and high-performance computing workload optimization is projected to grow at a 17.31% CAGR through 2031, making it the fastest-growing application area. That growth follows the shift in AI energy demand toward live inference, where scheduling decisions can be repeated at scale across high-frequency production workloads. The Green Software Foundation's SCI for AI work provides a more formal measurement framework for that use case, making it easier for enterprise teams to justify investment in workload-level carbon controls. Other applications, such as edge scheduling and IoT telemetry, remain early, but they benefit as carbon data becomes more ambient across connected systems and developer tools.
Complete Report Scope:
- By Component
- Platform
- Services
- Implementation and Integration Services
- Support and Maintenance Services
- By Application
- Carbon-Aware Kubernetes Scheduling
- Carbon Intensity APIs
- AI and High-Performance Computing Workload Optimization
- Continuous Integration (CI)/Continuous Delivery (CD) and Developer Workflow Integration
- Other Applications
- By Deployment Mode
- Cloud-Based
- On-Premises
- Hybrid
- By Organization Size
- Large Enterprises
- Small and Medium Enterprises
- By End User
- Information Technology and Telecom
- Banking, Financial Services, and Insurance
- Energy and Utilities
- Manufacturing
- Retail and E-Commerce
- Healthcare and Life Sciences
- Other End Users
- By Geography
- North America
- United States
- Canada
- Mexico
- South America
- Brazil
- Argentina
- Rest of South America
- Europe
- Germany
- United Kingdom
- France
- Italy
- Spain
- Russia
- Rest of Europe
- Asia-Pacific
- China
- India
- Japan
- South Korea
- Australia
- Rest of Asia-Pacific
- Middle East
- Saudi Arabia
- United Arab Emirates
- Turkey
- Rest of Middle East
- Africa
- South Africa
- Nigeria
- Rest of Africa
- North America
Geography Analysis
North America held 37.29% of the carbon-aware API and SDK platform market share in 2025, maintaining its position as the leading regional demand center. The region benefits from dense hyperscale infrastructure, large cloud-native developer communities, and early exposure to carbon-aware open-source tooling. California SB 253 and SB 261 broadened the compliance base by creating disclosure pressure that does not depend on federal climate rule continuity. The SEC proposed rescinding its climate disclosure rules in May 2026, but that change did not remove state-level obligations or address the needs of companies that still operate in stricter overseas reporting environments. South America remained smaller, with Brazil providing the clearest near-term signal through its large IT sector and through subsidiaries tied to European reporting expectations.
Europe did not have a disclosed regional share figure in the input, yet it remained the most policy-dense part of the carbon-aware application programming interface (API) and software development kit (SDK) platform market. CSRD reporting in 2026 is increasing demand for application-level software emissions data that can be structured in a more consistent and auditable form. Germany, the United Kingdom, and France stood out as the largest national demand centers because they combine strong enterprise reporting maturity with large developer and cloud ecosystems. The Middle East is still early, but sovereign cloud programs in Saudi Arabia and the UAE are beginning to create a policy-led opening for carbon measurement in data center and digital infrastructure planning.
Asia-Pacific is projected to grow at a 17.04% CAGR through 2031, making it the fastest-growing regional market for the carbon-aware application programming interface and software development kit platform market. Japan is shaping much of that momentum through its evolving SSBJ disclosure guidance and NTT's March 2026 publication of CO2 rules for the cradle-to-grave software lifecycle. South Korea adds another policy anchor with mandatory ESG reporting for large listed companies, while India's growth is led more by export-oriented IT services exposure than by domestic regulation. China is building a longer-term pathway through standards participation and broader carbon policy development, while Africa remains nascent, with demand concentrated in a small number of multinational-linked operations.
- Watershed Technology, Inc.
- Persefoni AI, Inc.
- Normative AB
- Plan A Earth GmbH
- Sweep SAS
- Greenly SAS
- Emitwise Limited
- Asuene Inc.
- 51toCarbonZero Limited
- Key ESG Limited
- FigBytes Inc.
- Novisto Inc.
- Sphera Solutions, Inc.
- Measurabl, Inc.
- Sinai Technologies, Inc.
- CarbonTrail Ltd.
- Brightest GmbH
- Unravel Carbon Pte. Ltd.
- Climatiq GmbH
- CarbonChain Ltd.
Additional Benefits:
- The market estimate (ME) sheet in Excel format
- 3 months of analyst support
TABLE OF CONTENTS
1 INTRODUCTION
- 1.1 Study Assumptions and Market Definition
- 1.2 Scope of the Study
2 RESEARCH METHODOLOGY
3 EXECUTIVE SUMMARY
4 MARKET LANDSCAPE
- 4.1 Market Overview
- 4.2 Market Drivers
- 4.2.1 Increasing Audit-Ready Carbon Disclosure Requirements
- 4.2.2 FinOps and Carbon Cost Co-Optimization
- 4.2.3 AI and High-Performance Compute Workload Carbon Visibility
- 4.2.4 Carbon Intensity API Adoption For Runtime Scheduling
- 4.2.5 Standardization of Software Carbon Metrics and Tooling
- 4.2.6 Embedded Sustainability Controls In Engineering Workflows
- 4.3 Market Restraints
- 4.3.1 Fragmented Carbon Signal Data Quality Across Providers
- 4.3.2 Integration Burden Across Cloud, DevOps, and Application Stacks
- 4.3.3 Performance Tradeoffs in Aggressive Carbon-Aware Scheduling
- 4.3.4 Limited Buyer Readiness to Operationalize Developer-Facing Carbon Workflows
- 4.4 Industry Value Chain Analysis
- 4.5 Regulatory Landscape
- 4.6 Technological Outlook
- 4.7 Impact of Macroeconomic Factors on the Market
- 4.8 Porter's Five Forces Analysis
- 4.8.1 Threat of New Entrants
- 4.8.2 Bargaining Power of Suppliers
- 4.8.3 Bargaining Power of Buyers
- 4.8.4 Threat of Substitutes
- 4.8.5 Intensity of Competitive Rivalry
5 MARKET SIZE AND GROWTH FORECASTS (VALUE)
- 5.1 By Component
- 5.1.1 Platform
- 5.1.2 Services
- 5.1.2.1 Implementation and Integration Services
- 5.1.2.2 Support and Maintenance Services
- 5.2 By Application
- 5.2.1 Carbon-Aware Kubernetes Scheduling
- 5.2.2 Carbon Intensity APIs
- 5.2.3 AI and High-Performance Computing Workload Optimization
- 5.2.4 Continuous Integration (CI)/Continuous Delivery (CD) and Developer Workflow Integration
- 5.2.5 Other Applications
- 5.3 By Deployment Mode
- 5.3.1 Cloud-Based
- 5.3.2 On-Premises
- 5.3.3 Hybrid
- 5.4 By Organization Size
- 5.4.1 Large Enterprises
- 5.4.2 Small and Medium Enterprises
- 5.5 By End User
- 5.5.1 Information Technology and Telecom
- 5.5.2 Banking, Financial Services, and Insurance
- 5.5.3 Energy and Utilities
- 5.5.4 Manufacturing
- 5.5.5 Retail and E-Commerce
- 5.5.6 Healthcare and Life Sciences
- 5.5.7 Other End Users
- 5.6 By Geography
- 5.6.1 North America
- 5.6.1.1 United States
- 5.6.1.2 Canada
- 5.6.1.3 Mexico
- 5.6.2 South America
- 5.6.2.1 Brazil
- 5.6.2.2 Argentina
- 5.6.2.3 Rest of South America
- 5.6.3 Europe
- 5.6.3.1 Germany
- 5.6.3.2 United Kingdom
- 5.6.3.3 France
- 5.6.3.4 Italy
- 5.6.3.5 Spain
- 5.6.3.6 Russia
- 5.6.3.7 Rest of Europe
- 5.6.4 Asia-Pacific
- 5.6.4.1 China
- 5.6.4.2 India
- 5.6.4.3 Japan
- 5.6.4.4 South Korea
- 5.6.4.5 Australia
- 5.6.4.6 Rest of Asia-Pacific
- 5.6.5 Middle East
- 5.6.5.1 Saudi Arabia
- 5.6.5.2 United Arab Emirates
- 5.6.5.3 Turkey
- 5.6.5.4 Rest of Middle East
- 5.6.6 Africa
- 5.6.6.1 South Africa
- 5.6.6.2 Nigeria
- 5.6.6.3 Rest of Africa
- 5.6.1 North America
6 COMPETITIVE LANDSCAPE
- 6.1 Market Concentration
- 6.2 Strategic Moves
- 6.3 Market Share Analysis
- 6.4 Company Profiles (includes Global Level Overview, Market Level Overview, Core Segments, Financials as available, Strategic Information, Market Rank/Share, Products and Services, Recent Developments)
- 6.4.1 Watershed Technology, Inc.
- 6.4.2 Persefoni AI, Inc.
- 6.4.3 Normative AB
- 6.4.4 Plan A Earth GmbH
- 6.4.5 Sweep SAS
- 6.4.6 Greenly SAS
- 6.4.7 Emitwise Limited
- 6.4.8 Asuene Inc.
- 6.4.9 51toCarbonZero Limited
- 6.4.10 Key ESG Limited
- 6.4.11 FigBytes Inc.
- 6.4.12 Novisto Inc.
- 6.4.13 Sphera Solutions, Inc.
- 6.4.14 Measurabl, Inc.
- 6.4.15 Sinai Technologies, Inc.
- 6.4.16 CarbonTrail Ltd.
- 6.4.17 Brightest GmbH
- 6.4.18 Unravel Carbon Pte. Ltd.
- 6.4.19 Climatiq GmbH
- 6.4.20 CarbonChain Ltd.
7 MARKET OPPORTUNITIES AND FUTURE OUTLOOK
- 7.1 White-Space and Unmet-Need Assessment

