
PUBLISHER: Mordor Intelligence | PRODUCT CODE: 2073517

PUBLISHER: Mordor Intelligence | PRODUCT CODE: 2073517
All Flash Array - Market Share Analysis, Industry Trends & Statistics, Growth Forecasts (2026 - 2031)
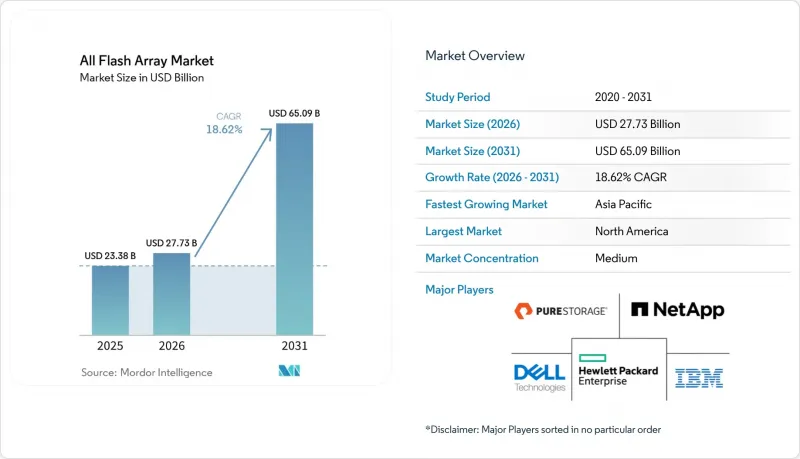
According to Mordor Intelligence, the all flash array market size is expected to grow from USD 23.38 billion in 2025 to USD 27.73 billion in 2026 and is forecast to reach USD 65.09 billion by 2031 at 18.62% CAGR over 2026-2031.
This report is Segmented by Architecture (Scale-Up, Scale-Out, and NVMe-OF Disaggregated), Capacity (<=20 TB, 20-100 TB, and >100 TB), Interface Protocol (SAS/SATA, Fibre Channel, and More), End-User Industry (IT and Telecom, BFSI, Healthcare and Life Sciences, and More), and Geography. The Market Forecasts are Provided in Terms of Value (USD).
Global All Flash Array Market Trends and Insights
Surging hyperscale and edge data-center buildouts
Hyperscale cloud operators collectively allocated more than USD 130 billion in 2025 capex for AI-optimized campuses, and storage now captures roughly one-fifth of that spend. New facilities require dense, low-latency flash tiers to feed thousands of GPUs that process large language model parameters. In parallel, edge deployments at retail outlets, cell towers, and manufacturing sites favor compact flash systems that tolerate vibration and temperature variations yet still deliver consistent throughput. Vendors are responding with unified controller code that scales from two-node edge appliances to rack-scale NVMe-oF fabrics inside core data centers. Utility-driven power caps in major metros further accelerate the move from hybrid drives to flash that delivers higher IOPS per watt. As a result, the All Flash Array market benefits from synchronized demand across centralized clouds and distributed edge nodes.
Performance-critical AI and real-time analytics workloads
AI model training saturates storage links with sequential writes, while inference workloads depend on microsecond random reads. These dual-workload profiles expose the latency and queue-depth limits of hybrid arrays, accelerating adoption of AI powered Storage and pushing banks, insurers, and e-commerce platforms toward all-flash systems. Financial institutions deploying algorithmic trading engines report tangible revenue gains after migrating tick-data stores to all-flash platforms validated under STAC benchmarks. Hospitals leverage flash-based PACS archives to let AI diagnostic engines review MRI and CT scans without delay, accelerating time to diagnosis. Manufacturers run predictive maintenance models on edge-hosted GPUs that ingest sensor telemetry in real time, a workflow that collapses if storage stalls. The convergence of retrieval-augmented generation, graph queries, and streaming analytics positions the All Flash Array market as foundational for next-generation data pipelines.
Up-front capex premium versus hybrid arrays
Even with falling SSD prices, an entry-level all-flash node still lists 40% to 60% higher than a hybrid alternative of equal usable capacity. CFOs in price-sensitive verticals often prioritize initial purchase cost over five-year TCO, delaying flash migration projects. SMEs in Latin America and parts of Southeast Asia extend the life of disk-based arrays by adding cache upgrades rather than shifting workloads outright. Economic uncertainty following inflationary cycles has elongated procurement approvals, further suppressing near-term All Flash Array market conversions.
Other drivers and restraints analyzed in the detailed report include:
- Rapid decline in NAND cost per bit
- Energy-efficiency mandates for enterprise IT
- Controller bottlenecks in scale-up architectures
For complete list of drivers and restraints, kindly check the Table Of Contents.
Segment Analysis
Scale-up arrays delivered 47.12% of 2025 revenue, keeping them the largest contributor to the All Flash Array market. The familiar dual-controller footprint integrates with existing SAN orchestration, explaining its staying power. Yet the same architecture struggles to utilize ever-denser NVMe drives, nudging performance-critical buyers toward scale-out or fully disaggregated NVMe-oF designs. Vendors mitigate risk by adding stateless compute shelves and caching layers, but these retrofits cannot erase fundamental controller constraints.
In contrast, NVMe-oF disaggregated clusters are projected to post a 19.45% CAGR to 2031, the fastest within the All Flash Array market. Disaggregation eliminates single-chassis bottlenecks by pushing storage logic to Ethernet-attached nodes that scale linearly. Pure Storage and several software-defined entrants showcase petabyte-scale GPU farms built on this model, citing sustained line-rate throughput figures during AI model checkpoints. Adoption still hinges on data-center teams mastering RDMA, congestion control, and multi-pathing across high-speed Ethernet, creating a skills gap that tempers near-term rollouts.
The 20-100 TB band held 49.25% of 2025 deployments, representing the sweet spot for database consolidation and VM sprawl elimination. This range balances price, rack power, and rebuild windows, making it the default for mid-sized enterprise refresh cycles. QLC flash plus aggressive inline compression yields effective capacities that dwarf predecessor hybrids without forcing operators into exotic chassis designs.
Systems above 100 TB are forecast to grow at 19.61% CAGR through 2031, outpacing the overall All Flash Array market. Hyperscalers favor these dense shelves to feed GPU clusters where locality lowers east-west traffic costs. Financial trading hubs also gravitate toward high-density builds, consolidating tick history and back-testing libraries onto singular ultra-low-latency pools. Micron's 150 TB DirectFlash Module, co-engineered with Pure Storage, exemplifies the vendor push toward multi-petabyte racks that promise fewer cables, fewer watts, and uncompromised bandwidth.
Complete Report Scope:
- By Architecture
- Scale-Up
- Scale-Out
- NVMe-oF Disaggregated
- By Capacity (Usable)
- <=20 TB
- 20 - 100 TB
- >100 TB
- By Interface Protocol
- SAS/SATA
- Fibre Channel
- iSCSI
- NVMe
- By End-User Industry
- IT and Telecom
- BFSI
- Healthcare and Life Sciences
- Government and Public Sector
- Media and Entertainment
- Manufacturing and Energy
- Other End-User Industries
- By Geography
- North America
- United States
- Canada
- Mexico
- South America
- Brazil
- Argentina
- Chile
- Rest of South America
- Europe
- Germany
- United Kingdom
- France
- Italy
- Spain
- Rest of Europe
- Asia-Pacific
- China
- Japan
- South Korea
- India
- Singapore
- Australia
- Rest of Asia-Pacific
- Middle East and Africa
- Middle East
- Saudi Arabia
- United Arab Emirates
- Turkey
- Rest of Middle East
- Africa
- South Africa
- Nigeria
- Egypt
- Rest of Africa
- Middle East
- North America
Geography Analysis
North America generated 38.24% of 2025 revenue, anchored by U.S. hyperscalers expanding AI clusters and Wall Street trading firms modernizing market-data lakes. The region allocates well over USD 50 billion each year to AI infrastructure, and all-flash tiers sit at the heart of every GPU pod. Strict SEC and FINRA rules also require write-once-read-many compliance, which modern flash arrays fulfill through immutable snapshot frameworks.
Asia-Pacific is the fastest-growing territory, registering a 20.30% CAGR to 2031 as factories automate quality control and national AI strategies proliferate sovereign data centers. China channels subsidies to local storage brands to offset export controls, while Japan and South Korea retrofit 5G edge nodes with compact flash shelves that process video analytics in place. India's IT-services hubs deploy all-flash racks inside next-generation co-location campuses to lower application response times for global clients. Singapore and Hong Kong twin their financial districts with regional disaster-recovery flash clusters to comply with faster clearing and settlement rules. Europe balances energy policy with digital innovation, driving enterprises toward storage that shrinks watt-hour footprints. Germany funds Industry 4.0 pilot lines that embed AI vision systems needing rapid data recall, while France invests in sovereign cloud regions equipped with all-flash backbone tiers. Nordic nations lure hyperscale entrants to hydro-powered campuses, securing new demand for high-density flash trays. Meanwhile, Middle East oil majors adopt flash arrays for seismic modeling rigs, and African telecoms roll out flash-backed mobile-money platforms that require 24 X 7 availability despite regional power volatility. Collectively, geographic diversification supports a resilient growth path for the All Flash Array market.
- Pure Storage Inc.
- Dell Technologies Inc.
- NetApp Inc.
- Hewlett Packard Enterprise Company
- IBM Corporation
- Huawei Technologies Co., Ltd.
- Hitachi Ltd. (Hitachi Vantara LLC)
- Western Digital Corporation
- Fujitsu Limited
- Violin Systems LLC
- Silk Platform Ltd.
- Lenovo Group Limited
- NEC Corporation
- Inspur Electronic Information Industry Co., Ltd.
- Nimbus Data Inc.
- VAST Data Ltd.
- DataDirect Networks Inc. (DDN)
- Pavilion Data Systems Inc.
- Seagate Technology Holdings plc
- AccelStor Inc.
- StorONE Inc.
Additional Benefits:
- The market estimate (ME) sheet in Excel format
- 3 months of analyst support
TABLE OF CONTENTS
1 INTRODUCTION
- 1.1 Study Assumptions and Market Definition
- 1.2 Scope of the Study
2 RESEARCH METHODOLOGY
3 EXECUTIVE SUMMARY
4 MARKET LANDSCAPE
- 4.1 Market Overview
- 4.2 Market Drivers
- 4.2.1 Surging hyperscale and edge data-centre buildouts
- 4.2.2 Rapid decline in NAND cost per bit
- 4.2.3 Performance-critical AI and real-time analytics workloads
- 4.2.4 Energy-efficiency mandates for enterprise IT
- 4.2.5 Tier-0 database consolidation in financial trading hubs
- 4.2.6 Cyber-recovery architectures demanding immutable flash snapshots
- 4.3 Market Restraints
- 4.3.1 Up-front capex premium versus hybrid arrays
- 4.3.2 Controller bottlenecks in scale-up architectures
- 4.3.3 Supply-chain volatility for high-density NAND
- 4.3.4 Limited endurance for write-intensive logging use-cases
- 4.4 Industry Value Chain Analysis
- 4.5 Regulatory Landscape
- 4.6 Technological Outlook
- 4.7 Impact of Macroeconomic Factors
- 4.8 Porter's Five Forces Analysis
- 4.8.1 Threat of New Entrants
- 4.8.2 Bargaining Power of Suppliers
- 4.8.3 Bargaining Power of Buyers
- 4.8.4 Threat of Substitutes
- 4.8.5 Intensity of Competitive Rivalry
5 MARKET SIZE AND GROWTH FORECASTS (VALUES)
- 5.1 By Architecture
- 5.1.1 Scale-Up
- 5.1.2 Scale-Out
- 5.1.3 NVMe-oF Disaggregated
- 5.2 By Capacity (Usable)
- 5.2.1 <=20 TB
- 5.2.2 20 - 100 TB
- 5.2.3 >100 TB
- 5.3 By Interface Protocol
- 5.3.1 SAS/SATA
- 5.3.2 Fibre Channel
- 5.3.3 iSCSI
- 5.3.4 NVMe
- 5.4 By End-User Industry
- 5.4.1 IT and Telecom
- 5.4.2 BFSI
- 5.4.3 Healthcare and Life Sciences
- 5.4.4 Government and Public Sector
- 5.4.5 Media and Entertainment
- 5.4.6 Manufacturing and Energy
- 5.4.7 Other End-User Industries
- 5.5 By Geography
- 5.5.1 North America
- 5.5.1.1 United States
- 5.5.1.2 Canada
- 5.5.1.3 Mexico
- 5.5.2 South America
- 5.5.2.1 Brazil
- 5.5.2.2 Argentina
- 5.5.2.3 Chile
- 5.5.2.4 Rest of South America
- 5.5.3 Europe
- 5.5.3.1 Germany
- 5.5.3.2 United Kingdom
- 5.5.3.3 France
- 5.5.3.4 Italy
- 5.5.3.5 Spain
- 5.5.3.6 Rest of Europe
- 5.5.4 Asia-Pacific
- 5.5.4.1 China
- 5.5.4.2 Japan
- 5.5.4.3 South Korea
- 5.5.4.4 India
- 5.5.4.5 Singapore
- 5.5.4.6 Australia
- 5.5.4.7 Rest of Asia-Pacific
- 5.5.5 Middle East and Africa
- 5.5.5.1 Middle East
- 5.5.5.1.1 Saudi Arabia
- 5.5.5.1.2 United Arab Emirates
- 5.5.5.1.3 Turkey
- 5.5.5.1.4 Rest of Middle East
- 5.5.5.2 Africa
- 5.5.5.2.1 South Africa
- 5.5.5.2.2 Nigeria
- 5.5.5.2.3 Egypt
- 5.5.5.2.4 Rest of Africa
- 5.5.5.1 Middle East
- 5.5.1 North America
6 COMPETITIVE LANDSCAPE
- 6.1 Market Concentration
- 6.2 Strategic Moves
- 6.3 Market Share Analysis
- 6.4 Company Profiles (includes Global level Overview, Market level overview, Core Segments, Financials as available, Strategic Information, Market Rank/Share for key companies, Products and Services, and Recent Developments)
- 6.4.1 Pure Storage Inc.
- 6.4.2 Dell Technologies Inc.
- 6.4.3 NetApp Inc.
- 6.4.4 Hewlett Packard Enterprise Company
- 6.4.5 IBM Corporation
- 6.4.6 Huawei Technologies Co., Ltd.
- 6.4.7 Hitachi Ltd. (Hitachi Vantara LLC)
- 6.4.8 Western Digital Corporation
- 6.4.9 Fujitsu Limited
- 6.4.10 Violin Systems LLC
- 6.4.11 Silk Platform Ltd.
- 6.4.12 Lenovo Group Limited
- 6.4.13 NEC Corporation
- 6.4.14 Inspur Electronic Information Industry Co., Ltd.
- 6.4.15 Nimbus Data Inc.
- 6.4.16 VAST Data Ltd.
- 6.4.17 DataDirect Networks Inc. (DDN)
- 6.4.18 Pavilion Data Systems Inc.
- 6.4.19 Seagate Technology Holdings plc
- 6.4.20 AccelStor Inc.
- 6.4.21 StorONE Inc.
7 MARKET OPPORTUNITIES AND FUTURE OUTLOOK
- 7.1 White-space and Unmet-Need Assessment

