
PUBLISHER: Mordor Intelligence | PRODUCT CODE: 2073521

PUBLISHER: Mordor Intelligence | PRODUCT CODE: 2073521
Educational Robot - Market Share Analysis, Industry Trends & Statistics, Growth Forecasts (2026 - 2031)
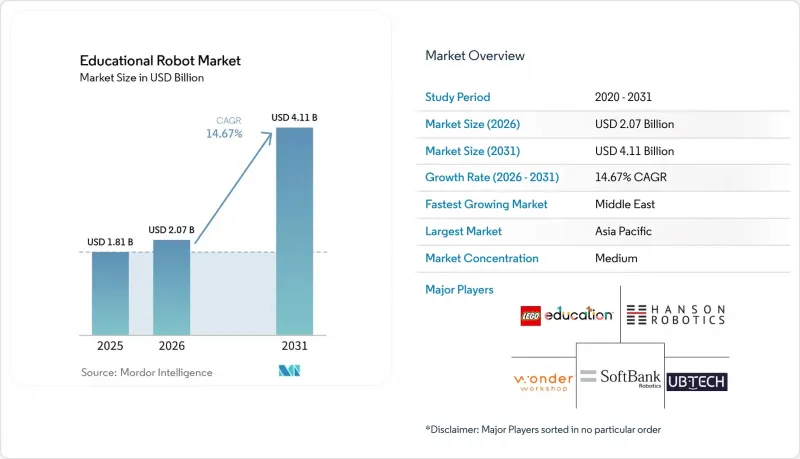
According to Mordor Intelligence, the educational robot market size is expected to grow from USD 1.81 billion in 2025 to USD 2.07 billion in 2026 and is forecast to reach USD 4.11 billion by 2031 at 14.67% CAGR over 2026-2031.
This report is Segmented by Type (Humanoid, and Non-Humanoid), Component (Hardware, Software, and Services), Education Level (Pre-Primary, Primary, and More), Learning Mode (Coding and STEM, Language, and More), End User (Schools, Universities, and More), and Geography (North America, South America, Europe, Asia-Pacific, Middle East, Africa). The Market Forecasts are Provided in Terms of Value (USD).
Global Educational Robot Market Trends and Insights
Mandatory Robotics Curriculum in K-12 Schools Across Europe
The European Commission's 2025 STEM Education Strategic Plan obliges every member state to weave computational thinking and robotics into core K-12 standards by the 2027-28 academic year. Ministries of education now negotiate multi-year framework contracts, favoring ISO-certified vendors able to guarantee CE-compliant hardware and curriculum alignment. Finland earmarked EUR 120 million (USD 135.6 million) in 2025 to outfit 2,400 primary schools, while Germany reserved EUR 500 million (USD 565 million) through 2028 under Digital Pact 2.0. Because the directive insists robotics account for at least 10% of STEM contact time, the addressable classroom pool effectively doubles, and replacement demand will mirror curriculum-revision cycles rather than wear-and-tear schedules. By shifting purchasing power to national agencies, the rule stabilizes volume forecasts and encourages vendors to invest in local language content and long-term professional-development services.
Government-Funded STEM Initiatives Fueling University Procurement in North America
The U.S. National Science Foundation expanded its RITEL program in 2025, pledging USD 85 million over three years and stipulating that 40% of awards finance hardware for underserved institutions. Historically Black and Hispanic-serving colleges now access humanoid research platforms they previously could not afford, while Canadian counterpart NSERC committed CAD 60 million (USD 44.4 million) to create 15 regional robotics hubs. Grant recipients must publish open-source curriculum modules, trimming content-development costs for later adopters and accelerating usage beyond the initial grantees. Peer-reviewed evidence from these universities feeds district procurement cycles, reducing risk perceptions and moving educational robot market adoption further down the cost curve.
GDPR-Driven Data-Privacy Compliance Costs for Cloud-Connected Robots in Europe
GDPR threatens fines of EUR 20 million (USD 23.22 million) or 4% of global turnover, forcing vendors to implement consent workflows, conduct impact assessments, and conduct third-party audits that cost EUR 50,000-150,000 (USD 56,500-169,500) per European school district. Districts with per-pupil IT budgets below EUR 120 (USD 135) struggle to absorb the outlay, slowing deployments in Southern and Eastern Europe. Privacy-by-design clauses also shift processing to the device, elevating the bill of materials by 30-40% for edge AI chips. Non-compliant bidders are barred, as seen in France's 2024 cancellation of a USD 12 million tender. Extraterritorial reach means even non-EU vendors must appoint EU data officers, adding USD 40,000-80,000 in annual overhead that compresses margins on sub-USD 500 robots.
Other drivers and restraints analyzed in the detailed report include:
- Adoption of AI-Enabled Social Robots for Early-Childhood Language Tutoring in East Asia
- Falling Prices of Education-Grade Servo Motors and Sensors
- High Failure Rates of Battery Packs in Tropical Classrooms
For complete list of drivers and restraints, kindly check the Table Of Contents.
Segment Analysis
Humanoid robots captured 49.13% educational robot market share in 2025 and are projected to expand at a 15.03% CAGR through 2031. Their anthropomorphic design supports eye contact, gesture recognition, and proxemics that align with special-education and language-acquisition frameworks, prompting ministries to favor these units in compliance-driven tenders. A 2024 study showed children sustained attention 42% longer with humanoid tutors than with tablets. NAO and Yanshee dominate through curriculum partnerships that reduce teacher preparation time.
Non-humanoid platforms, including wheeled rovers and modular kits, lead in coding and maker spaces because schools can buy a full classroom set for the price of two humanoids. Improved durability extends replacement cycles to seven years, so vendors now bundle cloud content to maintain revenue. As therapeutic robots earn FDA clearances, insurance reimbursement moves humanoid purchases into clinical budgets, intensifying the bifurcation between premium social-learning devices and cost-focused STEM kits.
Hardware accounted for 58.36% of the educational robot market in 2025, yet software is growing fastest at a 16.17% CAGR. Districts pay USD 5-15 per student annually for curriculum libraries that integrate with Google Classroom and Canvas, reducing onboarding friction for teachers. Single Sign-On mandates, now at 62% of U.S. districts, create technical barriers while imposing switching costs once integrations are complete.
Hardware growth moderates as servos reach 50,000-cycle durability and schools stretch refresh intervals. Services revenue remains under-penetrated, but vendors offering multi-year professional development report 25% lower churn because teachers who log 20+ training hours weave robots into daily instruction. The longer-term trajectory points to software-defined classrooms where hardware functions as a durable endpoint while analytics and AI personalization engines monetize learning data.
Complete Report Scope:
- By Type
- Humanoid
- Non-Humanoid
- By Component
- Hardware
- Software
- Services
- By Education Level
- Pre-Primary (Kindergarten)
- Primary Education
- Secondary Education
- Higher Education
- Special Education
- By Learning Mode / Application
- Coding and STEM
- Language Learning
- AI and Robotics Research
- Special-Needs Therapy
- Telepresence and Remote Instruction
- By End User
- Schools
- Universities and Colleges
- Vocational Institutes
- Ed-Tech Companies
- Special-Education Centers
- Maker Spaces and Robotics Clubs
- By Geography
- North America
- United States
- Canada
- Mexico
- Europe
- Germany
- United Kingdom
- France
- Italy
- Spain
- Russia
- Rest of Europe
- Asia Pacific
- China
- Japan
- India
- South Korea
- ASEAN
- Australia and New Zealand
- Rest of Asia Pacific
- South America
- Brazil
- Argentina
- Rest of South America
- Middle East
- Saudi Arabia
- UAE
- Turkey
- Rest of Middle East
- Africa
- South Africa
- Nigeria
- Rest of Africa
- North America
Geography Analysis
Asia-Pacific generated 34.40% revenue in 2025, buoyed by China's nationwide AI literacy rule that touches 200,000+ primary schools. Japan provided JPY 12 billion (USD 80.4 million) in subsidies, and Seoul's pilots achieved 18% gains in English fluency. India's National Education Policy pushes coding from grade 6, but roll-out lags due to USD 15-30 per-pupil IT budgets. Australia shows private-school skew, with 68% of robotics kits in fee-paying campuses that house only 35% of students.
North America held a 28% share in 2025, yet growth slows as deployment saturation meets fiscal headwinds from shrinking student cohorts. NSF-funded hubs and Title I programs are pushing robots into underserved districts, but customs disputes have delayed Mexico's rural pilots.
Europe accounted for a 24% share in 2025, dominated by the forthcoming curriculum mandate and constrained by GDPR compliance levies. Finland and Germany front-load capital, yet Southern Europe struggles with per-pupil IT budgets under EUR 120 (USD 135).
The Middle East, led by Saudi Arabia and the UAE, logs the highest regional CAGR at 17.92% as Vision 2030 CSR funds sponsor urban robotics labs. South America wrestles with 60% Brazilian tariffs and currency swings, though Argentina deployed 800 kits in 2025. Africa remains below 5% share in 2025, hampered by the 9% baseline of digital-skill readiness among rural youth.
- SoftBank Robotics Corp.
- UBTECH Robotics Inc.
- Hanson Robotics Ltd.
- Lego Education (The Lego Group)
- Wonder Workshop Inc.
- Robotis Co., Ltd.
- VEX Robotics Inc.
- Makeblock Co., Ltd.
- Sphero Inc.
- Modular Robotics (Cubelets)
- Blue Frog Robotics
- Aisoy Robotics
- Sanbot Innovation (Qihan)
- PAL Robotics
- Probotics America
- Robobuilder Co., Ltd.
- Dash Robotics (Kamigami)
- RobotLAB Inc.
- DJI RoboMaster
- Ozobot and Evollve Inc.
- Fischertechnik GmbH
- RoboTerra Inc.
- Roborisen (e-Bo)
- RoboSense (Edu)
Additional Benefits:
- The market estimate (ME) sheet in Excel format
- 3 months of analyst support
TABLE OF CONTENTS
1 INTRODUCTION
- 1.1 Study Assumptions and Market Definition
- 1.2 Scope of the Study
2 RESEARCH METHODOLOGY
3 EXECUTIVE SUMMARY
4 MARKET LANDSCAPE
- 4.1 Market Overview
- 4.2 Market Drivers
- 4.2.1 Adoption of AI-Enabled Social Robots for Early-Childhood Language Tutoring in East Asia
- 4.2.2 Mandatory Robotics Curriculum in K-12 Schools across Europe
- 4.2.3 Government-Funded STEM Initiatives Fueling University Procurement in North America
- 4.2.4 Falling Average Selling Price of Education-Grade Servo Motors and Sensors in China
- 4.2.5 Surge of Remote and Hybrid Learning Driving Telepresence Teaching Robots in North America
- 4.2.6 Corporate CSR Budgets Sponsoring Robotics Labs in Middle East Public Schools
- 4.3 Market Restraints
- 4.3.1 High Failure Rates of Battery Packs During Continuous Classroom Use in Tropical Regions
- 4.3.2 Limited Multilingual Content Libraries for Humanoid Robots in Non-Latin Script Nations
- 4.3.3 GDPR-Driven Data-Privacy Compliance Costs for Cloud-Connected Robots in Europe
- 4.3.4 Shortage of Certified Robotics Instructors in Rural Africa
- 4.4 Industry Value Chain Analysis
- 4.5 Regulatory Outlook
- 4.6 Technological Outlook
- 4.7 Impact of Macroeconomic Factors on the Market
- 4.8 Porter's Five Forces Analysis
- 4.8.1 Threat of New Entrants
- 4.8.2 Bargaining Power of Buyers
- 4.8.3 Bargaining Power of Suppliers
- 4.8.4 Threat of Substitutes
- 4.8.5 Intensity of Competitive Rivalry
- 4.9 Investment Analysis (Funding, M&A, VC Trends)
5 MARKET SIZE AND GROWTH FORECASTS (VALUE)
- 5.1 By Type
- 5.1.1 Humanoid
- 5.1.2 Non-Humanoid
- 5.2 By Component
- 5.2.1 Hardware
- 5.2.2 Software
- 5.2.3 Services
- 5.3 By Education Level
- 5.3.1 Pre-Primary (Kindergarten)
- 5.3.2 Primary Education
- 5.3.3 Secondary Education
- 5.3.4 Higher Education
- 5.3.5 Special Education
- 5.4 By Learning Mode / Application
- 5.4.1 Coding and STEM
- 5.4.2 Language Learning
- 5.4.3 AI and Robotics Research
- 5.4.4 Special-Needs Therapy
- 5.4.5 Telepresence and Remote Instruction
- 5.5 By End User
- 5.5.1 Schools
- 5.5.2 Universities and Colleges
- 5.5.3 Vocational Institutes
- 5.5.4 Ed-Tech Companies
- 5.5.5 Special-Education Centers
- 5.5.6 Maker Spaces and Robotics Clubs
- 5.6 By Geography
- 5.6.1 North America
- 5.6.1.1 United States
- 5.6.1.2 Canada
- 5.6.1.3 Mexico
- 5.6.2 Europe
- 5.6.2.1 Germany
- 5.6.2.2 United Kingdom
- 5.6.2.3 France
- 5.6.2.4 Italy
- 5.6.2.5 Spain
- 5.6.2.6 Russia
- 5.6.2.7 Rest of Europe
- 5.6.3 Asia Pacific
- 5.6.3.1 China
- 5.6.3.2 Japan
- 5.6.3.3 India
- 5.6.3.4 South Korea
- 5.6.3.5 ASEAN
- 5.6.3.6 Australia and New Zealand
- 5.6.3.7 Rest of Asia Pacific
- 5.6.4 South America
- 5.6.4.1 Brazil
- 5.6.4.2 Argentina
- 5.6.4.3 Rest of South America
- 5.6.5 Middle East
- 5.6.5.1 Saudi Arabia
- 5.6.5.2 UAE
- 5.6.5.3 Turkey
- 5.6.5.4 Rest of Middle East
- 5.6.6 Africa
- 5.6.6.1 South Africa
- 5.6.6.2 Nigeria
- 5.6.6.3 Rest of Africa
- 5.6.1 North America
6 COMPETITIVE LANDSCAPE
- 6.1 Market Concentration
- 6.2 Strategic Moves
- 6.3 Market Share Analysis
- 6.4 Company Profiles (includes Global Level Overview, Market Level Overview, Core Segments, Financials as Available, Strategic Information, Market Rank/Share, Products and Services, Recent Developments)
- 6.4.1 SoftBank Robotics Corp.
- 6.4.2 UBTECH Robotics Inc.
- 6.4.3 Hanson Robotics Ltd.
- 6.4.4 Lego Education (The Lego Group)
- 6.4.5 Wonder Workshop Inc.
- 6.4.6 Robotis Co., Ltd.
- 6.4.7 VEX Robotics Inc.
- 6.4.8 Makeblock Co., Ltd.
- 6.4.9 Sphero Inc.
- 6.4.10 Modular Robotics (Cubelets)
- 6.4.11 Blue Frog Robotics
- 6.4.12 Aisoy Robotics
- 6.4.13 Sanbot Innovation (Qihan)
- 6.4.14 PAL Robotics
- 6.4.15 Probotics America
- 6.4.16 Robobuilder Co., Ltd.
- 6.4.17 Dash Robotics (Kamigami)
- 6.4.18 RobotLAB Inc.
- 6.4.19 DJI RoboMaster
- 6.4.20 Ozobot and Evollve Inc.
- 6.4.21 Fischertechnik GmbH
- 6.4.22 RoboTerra Inc.
- 6.4.23 Roborisen (e-Bo)
- 6.4.24 RoboSense (Edu)
7 MARKET OPPORTUNITIES AND FUTURE OUTLOOK
- 7.1 White-Space and Unmet Need Analysis

