PUBLISHER: Mordor Intelligence | PRODUCT CODE: 2073547

PUBLISHER: Mordor Intelligence | PRODUCT CODE: 2073547
Connected Enterprise - Market Share Analysis, Industry Trends & Statistics, Growth Forecasts (2026 - 2031)
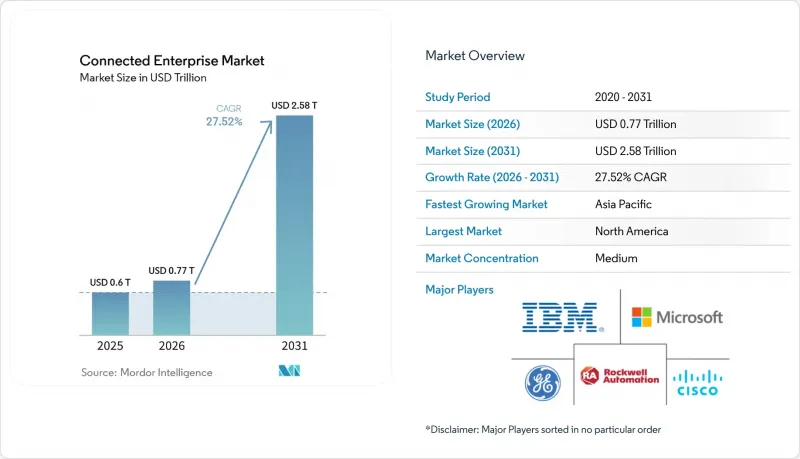
According to Mordor Intelligence, connected enterprise market size in 2026 is estimated at USD 0.77 trillion, growing from 2025 value of USD 0.6 trillion with 2031 projections showing USD 2.58 trillion, growing at 27.52% CAGR over 2026-2031.
This report is Segmented by Offering (Platforms, Solutions, and Services), Deployment Mode (On-Premise, Cloud, and Hybrid), End-User Vertical (Manufacturing, Energy and Utilities, and More), Enterprise Size (Large Enterprises and Small and Medium Enterprises), Connectivity Technology (Wi-Fi/Ethernet, Cellular (4G/LTE), and More), and Geography. The Market Forecasts are Provided in Terms of Value (USD).
Global Connected Enterprise Market Trends and Insights
Proliferation of Industrial IoT Devices and Sensors
Mounting sensor deployments are rewriting factory economics. A leading tyre producer saved INR 1 crore (USD 120,000) daily by linking machine-learning models with legacy assets, then lifted daily passenger-tyre output from 68,000 to 73,000 units without new equipment. Edge processors close feedback loops locally, so anomalies trigger instant actions instead of waiting for round-trip cloud calls. Retrofit kits cost less than wholesale replacement, letting operators extend gear life while feeding predictive-maintenance engines. Equipment makers monetise performance insights as subscription services, unlocking fresh revenue that cushions hardware cycles. This widespread sensor adoption is the single biggest feedstock for connected enterprise market growth.
Cloud-Native Adoption and iPaaS Expansion
Enterprises are shifting heavy workloads to cloud-native stacks that auto-scale across regions and burst compute on demand. Microsoft's intelligent cloud segment logged USD 42.4 billion revenue in Q1 2025, buoyed by industrial IoT and analytics workloads. Integration Platform as a Service unifies hundreds of OT protocols with enterprise applications, allowing material-traceability events to update ERP, MES, and transport systems in real time. Vendors now sell outcome-based contracts that guarantee uptime or energy savings instead of selling servers or licences, shifting risk toward suppliers but cementing multiyear revenue. Open APIs reduce vendor lock-in and accelerate competitive sourcing, an added driver for the connected enterprise market.
High Capex for Brown-Field Integration
Retrofitting decades-old machinery with sensors, gateways, and secure remote access strains capital budgets. Integration can cost USD 12,000 per legacy asset, and each site runs dozens or hundreds of such machines. SMEs lack in-house engineering depth, so they rely on specialist integrators that charge premium rates, elongating payback cycles. Diverse industrial protocols inflate project scope because multiple gateways and custom middleware must coexist. Modular retrofit kits and open interface standards are emerging to curb spend, yet financing hurdles still delay many projects.
Other drivers and restraints analyzed in the detailed report include:
- Real-Time Supply-Chain Visibility Needs
- Private 5G Networks Enabling Deterministic Latency
- Cybersecurity Skills Shortage and Expanding Attack Surface
For complete list of drivers and restraints, kindly check the Table Of Contents.
Segment Analysis
Solutions held 50.72% of connected enterprise market revenue in 2025, led by MES, EAM, and CX suites that digitalize discrete functions. Platforms, however, headline growth at a 30.12% CAGR as firms invest first in data fabrics and device-management layers before layering analytics. In 2026, the platforms slice is forecast to add USD 49.1 billion, signalling a structural pivot toward backbone investments. The connected enterprise market size for platforms is projected to widen sharply because multi-tenant architectures let vendors amortize R&D across customers while still offering tenant-twinned data boundaries. Services trail in absolute dollars but shift to outcome guarantees, where integrators shoulder performance risk.A platform-centric play allows enterprises to plug in AI inference, edge orchestration, and threat monitoring by API rather than by forklift upgrade. Device-lifecycle platforms simplify firmware patching across 100,000-plus assets, protecting uptime without site visits. As open-source frameworks mature, platforms will interoperate, letting buyers mix best-of-breed analytics with incumbent control systems instead of a rip-and-replace scenario. These shifts reinforce vendor ecosystems and spur new entrants that specialise in data-versioning, digital-twin orchestration, or role-based workflow configuration, deepening competition inside the connected enterprise market.
Cloud deployments formed 53.02% of the value in 2025 due to rapid scaling and pay-as-you-grow economics. Nevertheless, latency-sensitive or sovereign workloads have rekindled on-premises needs, sparking a 30.86% CAGR in hybrid solutions. The connected enterprise market size attributable to hybrid estates could top USD 1.14 trillion by 2031 as factories blend local edge nodes for sub-50 ms response with regional clouds for model training. Platform vendors now ship lightweight Kubernetes stacks that run PLC analytics beside the line, then sync summarized telemetry to centralized lakes.Hybrid blueprints mitigate egress costs, as only curated datasets leave the plant, and regulatory audits -such as Europe's emerging AI Act -can verify lineage on site. Operators thus enjoy cloud elasticity without surrendering control. Suppliers are differentiating through orchestration layers that auto-place workloads wherever compute, storage, security, and cost targets align. Over the forecast, winning propositions will embed AI to forecast resource demand and rebalance capacity autonomously, further propelling the connected enterprise market.
Complete Report Scope:
- By Offering
- Platforms
- Device Management
- Connectivity Management
- Other Platforms
- Solutions
- Manufacturing Execution System
- Enterprise Infrastructure Management
- Customer Experience Management
- Remote Monitoring System
- Asset Performance Management
- Other Solutions (Streaming Analytics, Mobile Workforce, Security)
- Services
- Managed
- Professional
- Platforms
- By Deployment Mode
- On-premise
- Cloud
- Hybrid
- By End-user Vertical
- Manufacturing
- Energy and Utilities
- Oil and Gas
- BFSI
- Retail and E-Commerce
- IT and Telecommunications
- Other End-user Verticals
- By Enterprise Size
- Large Enterprises
- Small and Medium Enterprises (SMEs)
- By Connectivity Technology
- Wi-Fi/Ethernet
- Cellular (4G/LTE)
- Private 5G
- LPWAN (LoRaWAN, NB-IoT)
- By Geography
- North America
- United States
- Canada
- Mexico
- South America
- Brazil
- Argentina
- Chile
- Rest of South America
- Europe
- Germany
- United Kingdom
- France
- Italy
- Spain
- Russia
- Rest of Europe
- Asia-Pacific
- China
- India
- Japan
- South Korea
- Malaysia
- Singapore
- Australia
- Rest of Asia-Pacific
- Middle East and Africa
- Middle East
- United Arab Emirates
- Saudi Arabia
- Turkey
- Rest of Middle East
- Africa
- South Africa
- Nigeria
- Rest of Africa
- Middle East
- North America
Geography Analysis
North America dominated with a 36.62% share in 2025, buoyed by early private-5G pilots, ample brownfield retrofits, and robust venture funding into industrial startups. Federal incentives for advanced manufacturing and clean-tech projects drive sensor deployments in battery plants and semiconductor fabs. Cloud hyperscalers headquartered in the region feed the value chain with AI-ready data lakes and low-code analytics that compress project timelines. Strategic pacts such as Rockwell Automation's expanded alliance with Microsoft integrate factory control and cloud inferencing, accelerating adoption.
Asia-Pacific is on a steeper 32.05% CAGR curve, propelled by continued industrialization and state-led smart-manufacturing programs. China's push for price-competitive automation drives local OEM innovation, while India's Production-Linked Incentive schemes entice multinationals to build connected greenfield plants. 5G coverage now blankets 75% of urban zones across Japan and South Korea, enabling fully wireless factories. Regional operators market private-network-as-a-service offers that bundle spectrum, edge compute, and cybersecurity, lowering barriers for mid-tier manufacturers. As a result, the connected enterprise market is likely to see Asia-Pacific overtake Europe in spend before 2029.
Europe holds a solid share anchored by stringent ESG and cybersecurity mandates. The Digital Operational Resilience Act forces financial institutions to harden OT/IT interfaces, while automotive OEMs invest in carbon-ledger twins to meet Scope 3 reporting duties. These rules spur demand for secure, auditable data pipelines, a hallmark of mature connected enterprise deployments. Meanwhile, the Middle East, Africa, and South America remain nascent but promising. Gulf energy players trial smart-refinery twins, Brazilian agribusiness outfits sensorize plantations, and South African miners test autonomous haulage backed by private LTE. As infrastructure gaps close, these regions will add incremental growth to the connected enterprise market without yet challenging the tri-continental leaders.
- Microsoft Corporation
- IBM Corporation
- General Electric Company
- Cisco Systems, Inc.
- Rockwell Automation, Inc.
- Verizon Communications, Inc.
- Harman International Industries Ltd.
- Jacobs Solutions Inc.
- PTC Inc.
- Amazon Web Services, Inc.
- SAP SE
- Schneider Electric SE
- Siemens AG
- Honeywell International Inc.
- Oracle Corporation
- Fujitsu Ltd.
- Bosch Rexroth AG
- ABB Ltd.
- Ericsson AB
- Hitachi Vantara LLC
- Dell Technologies Inc.
- Huawei Technologies Co. Ltd.
- Zebra Technologies Corp.
- Emerson Electric Co.
- Dassault Systemes SE
Additional Benefits:
- The market estimate (ME) sheet in Excel format
- 3 months of analyst support
TABLE OF CONTENTS
1 INTRODUCTION
- 1.1 Study Assumptions and Market Definition
- 1.2 Scope of the Study
2 RESEARCH METHODOLOGY
3 EXECUTIVE SUMMARY
4 MARKET LANDSCAPE
- 4.1 Market Overview
- 4.2 Market Drivers
- 4.2.1 Proliferation of industrial IoT devices and sensors
- 4.2.2 Cloud-native adoption and iPaaS expansion
- 4.2.3 Real-time, supply-chain visibility needs
- 4.2.4 Private 5G networks enabling deterministic latency
- 4.2.5 GenAI-powered autonomous enterprise workflows
- 4.2.6 ESG-linked digital twins for emissions reporting
- 4.3 Market Restraints
- 4.3.1 High capex for brown-field integration
- 4.3.2 Cyber-security skills shortage and attack surface
- 4.3.3 Fragmented device-firmware-update standards
- 4.3.4 Data-ownership disputes in ESG audits
- 4.4 Industry Value Chain Analysis
- 4.5 Regulatory Landscape
- 4.6 Technological Outlook
- 4.7 Industry Attractiveness - Porter's Five Forces Analysis
- 4.7.1 Threat of New Entrants
- 4.7.2 Bargaining Power of Buyers/Consumers
- 4.7.3 Bargaining Power of Suppliers
- 4.7.4 Threat of Substitute Products
- 4.7.5 Intensity of Competitive Rivalry
- 4.8 Impact of Macroeconomic Factors on the Market
5 MARKET SIZE AND GROWTH FORECASTS (VALUES)
- 5.1 By Offering
- 5.1.1 Platforms
- 5.1.1.1 Device Management
- 5.1.1.2 Connectivity Management
- 5.1.1.3 Other Platforms
- 5.1.2 Solutions
- 5.1.2.1 Manufacturing Execution System
- 5.1.2.2 Enterprise Infrastructure Management
- 5.1.2.3 Customer Experience Management
- 5.1.2.4 Remote Monitoring System
- 5.1.2.5 Asset Performance Management
- 5.1.2.6 Other Solutions (Streaming Analytics, Mobile Workforce, Security)
- 5.1.3 Services
- 5.1.3.1 Managed
- 5.1.3.2 Professional
- 5.1.1 Platforms
- 5.2 By Deployment Mode
- 5.2.1 On-premise
- 5.2.2 Cloud
- 5.2.3 Hybrid
- 5.3 By End-user Vertical
- 5.3.1 Manufacturing
- 5.3.2 Energy and Utilities
- 5.3.3 Oil and Gas
- 5.3.4 BFSI
- 5.3.5 Retail and E-Commerce
- 5.3.6 IT and Telecommunications
- 5.3.7 Other End-user Verticals
- 5.4 By Enterprise Size
- 5.4.1 Large Enterprises
- 5.4.2 Small and Medium Enterprises (SMEs)
- 5.5 By Connectivity Technology
- 5.5.1 Wi-Fi/Ethernet
- 5.5.2 Cellular (4G/LTE)
- 5.5.3 Private 5G
- 5.5.4 LPWAN (LoRaWAN, NB-IoT)
- 5.6 By Geography
- 5.6.1 North America
- 5.6.1.1 United States
- 5.6.1.2 Canada
- 5.6.1.3 Mexico
- 5.6.2 South America
- 5.6.2.1 Brazil
- 5.6.2.2 Argentina
- 5.6.2.3 Chile
- 5.6.2.4 Rest of South America
- 5.6.3 Europe
- 5.6.3.1 Germany
- 5.6.3.2 United Kingdom
- 5.6.3.3 France
- 5.6.3.4 Italy
- 5.6.3.5 Spain
- 5.6.3.6 Russia
- 5.6.3.7 Rest of Europe
- 5.6.4 Asia-Pacific
- 5.6.4.1 China
- 5.6.4.2 India
- 5.6.4.3 Japan
- 5.6.4.4 South Korea
- 5.6.4.5 Malaysia
- 5.6.4.6 Singapore
- 5.6.4.7 Australia
- 5.6.4.8 Rest of Asia-Pacific
- 5.6.5 Middle East and Africa
- 5.6.5.1 Middle East
- 5.6.5.1.1 United Arab Emirates
- 5.6.5.1.2 Saudi Arabia
- 5.6.5.1.3 Turkey
- 5.6.5.1.4 Rest of Middle East
- 5.6.5.2 Africa
- 5.6.5.2.1 South Africa
- 5.6.5.2.2 Nigeria
- 5.6.5.2.3 Rest of Africa
- 5.6.5.1 Middle East
- 5.6.1 North America
6 COMPETITIVE LANDSCAPE
- 6.1 Market Concentration
- 6.2 Strategic Moves
- 6.3 Market Share Analysis
- 6.4 Company Profiles (includes Global level Overview, Market level overview, Core Segments, Financials as available, Strategic Information, Market Rank/Share for key companies, Products and Services, and Recent Developments)
- 6.4.1 Microsoft Corporation
- 6.4.2 IBM Corporation
- 6.4.3 General Electric Company
- 6.4.4 Cisco Systems, Inc.
- 6.4.5 Rockwell Automation, Inc.
- 6.4.6 Verizon Communications, Inc.
- 6.4.7 Harman International Industries Ltd.
- 6.4.8 Jacobs Solutions Inc.
- 6.4.9 PTC Inc.
- 6.4.10 Amazon Web Services, Inc.
- 6.4.11 SAP SE
- 6.4.12 Schneider Electric SE
- 6.4.13 Siemens AG
- 6.4.14 Honeywell International Inc.
- 6.4.15 Oracle Corporation
- 6.4.16 Fujitsu Ltd.
- 6.4.17 Bosch Rexroth AG
- 6.4.18 ABB Ltd.
- 6.4.19 Ericsson AB
- 6.4.20 Hitachi Vantara LLC
- 6.4.21 Dell Technologies Inc.
- 6.4.22 Huawei Technologies Co. Ltd.
- 6.4.23 Zebra Technologies Corp.
- 6.4.24 Emerson Electric Co.
- 6.4.25 Dassault Systemes SE
7 INVESTMENT ANALYSIS
8 MARKET OPPORTUNITIES AND FUTURE TRENDS
- 8.1 White-Space and Unmet-Need Assessment

