
PUBLISHER: Mordor Intelligence | PRODUCT CODE: 2073580

PUBLISHER: Mordor Intelligence | PRODUCT CODE: 2073580
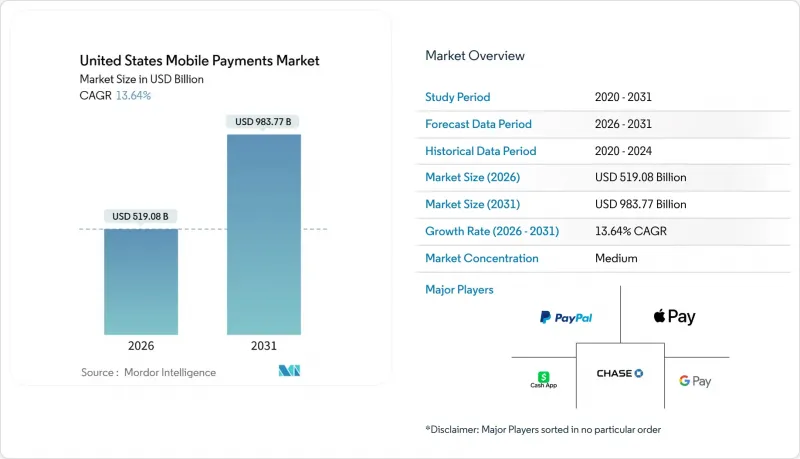
United States Mobile Payments - Market Share Analysis, Industry Trends & Statistics, Growth Forecasts (2026 - 2031)
According to Mordor Intelligence, the mobile payments market size in the United States stood at USD 519.08 billion in 2026 and is on course to reach USD 983.77 billion by 2031, translating into a 13.64% CAGR over the forecast window.
This report is Segmented by Payment Instrument (Real-Time Transfers, Mobile Wallets, and More), Transaction Channel (In-Store POS, E-Commerce, P2P Transfers, and More), Payment Type (Proximity Payments, and Remote Payments), and End-User Industry (Retail and FMCG, Transportation and Mobility, Hospitality and Tourism, and More). The Market Forecasts are Provided in Terms of Value (USD).
United States Mobile Payments Market Trends and Insights
Expansion Of FedNow And RTP Instant Rails
FedNow linked more than 1,400 financial institutions by October 2025, enabling sub-second, irrevocable transfers around the clock. The Clearing House's RTP network already handled 343 million payments totaling USD 246 billion in 2024. Community banks and credit unions are quickly onboarding to match neobanks that market real-time fund availability, accelerating their mainstream reach. Same-day settlement removes batch-processing float, helping households avoid late fees and merchants improve cash flow. Wallet providers must plug into these rails or risk losing bill-pay and disbursement volumes to bank-native push-payments.
P2P Wallet Adoption Surge
Zelle crossed the USD 1 trillion annual transaction value threshold in 2024 and reached 151 million enrolled users. Venmo posted USD 85 billion in transaction volume in the third quarter of 2025, up 14% year over year. Cash App counted 57 million monthly active users in the first quarter of 2025. Zelle's in-app bank integration eliminates the need for separate downloads, minimizing friction. Federal Reserve surveys show that 45% of remote payments were initiated on mobile in 2025. These trends tighten pressure on card-network interchange as more everyday payments bypass cards completely.
Data-Security And Privacy Concerns
It is estimated that most Americans worry about corporate data practices and the majority feel they lack control over personal information. A 2024 breach at a major processor exposed tokenized credentials for 12 million accounts, reinforcing skepticism. The Federal Trade Commission recorded 5.7 million fraud reports in 2024. State laws such as California's Consumer Privacy Act elevate compliance demands, hitting smaller fintechs hardest. Providers now publicize encryption standards, biometric safeguards, and rapid-breach alerts to rebuild trust, especially among older consumers who trail Gen Z in wallet usage.
Other drivers and restraints analyzed in the detailed report include:
- Tokenized Card-On-File Reduces Fraud And Boosts Acceptance
- Rapid Merchant Roll-Out Of NFC/Contactless Terminals
- Credit/Debit Card Rewards Lock-In
For complete list of drivers and restraints, kindly check the Table Of Contents.
Segment Analysis
The payment-instrument landscape shows mobile wallets holding 47.83% share in 2025, yet real-time transfers are projected to post a 14.54% CAGR, the fastest within the mobile payments market. FedNow's 1,400-member network and RTP's 343 million transactions underscore readiness for scale. Wallet leaders must integrate these endpoints to stay relevant as consumers prize immediacy over brand affinity. Card-based flows act as a bridge for merchants tied to existing acquirer contracts, while carrier billing remains niche for digital-content micro-purchases.
Competitive dynamics reveal that PayPal's Venmo logged USD 85 billion in the third quarter of 2025, while Zelle's embedded model now reaches 151 million users without separate enrollment. Visa and Mastercard answer with tokenized Click to Pay, preserving interchange while promising one-click checkout. As settlement speed becomes table stakes, the mobile payments market size for real-time instruments is set to grow rapidly.
E-commerce contributed 47.83% of 2025 value, buoyed by USD 310.3 billion in online retail sales in Q3 2025. Yet P2P transfers are expected to grow at a 14.62% CAGR, propelled by Zelle's USD 1 trillion milestone and Venmo's strong double-digit expansion. Gen Z users treat P2P apps as default settlement tools for rent, group dining, and gig payments, displacing checks. Contactless transit programs such as New York's OMNY, which recorded over 1 billion taps, reinforce mobile behavior in daily commuting.
In-store transactions gain from NFC terminal saturation, and card-network initiatives keep one-tap convenience device-agnostic. Bill payments and government remittances remain laggards as legacy systems persist, but the mobile payments market is beginning to see pilot instant bill-pay features riding FedNow. Cross-border flows still face FX friction; however, Visa Direct processed 7.5 billion transactions worldwide in 2024, signaling early traction.
Complete Report Scope:
- By Payment Instrument
- Real-Time Transfers (RTP/FedNow)
- Mobile Wallets (Apple Pay, PayPal, etc.)
- Card-based Mobile Payments
- Carrier Billing / Others
- By Transaction Channel
- In-store POS
- E-commerce
- P2P Transfers
- Bill and Government Payments
- Cross-border / Tourist
- By Payment Type
- Proximity Payments
- Remote Payments
- By End-User Industry
- Retail and FMCG
- Transportation and Mobility
- Hospitality and Tourism
- Utilities and Telecom
- Healthcare and Education
- Other End-User Industries
List of Companies Covered in this Report:
- Apple Inc.
- PayPal Holdings Inc.
- Block Inc.
- Google LLC (Google Pay)
- Early Warning Services LLC (Zelle)
- Samsung Electronics Co., Ltd.
- JPMorgan Chase and Co. (Chase Pay)
- Microsoft Corp. (Microsoft Pay)
- Mastercard Inc. (Click to Pay)
- Visa Inc. (Visa Direct / Click to Pay)
- Stripe Inc.
- Amazon.com Inc. (Amazon Pay)
- Walmart Inc. (Walmart Pay)
- Garmin Ltd.
- Cash App
- BitPay Inc.
- Affirm Holdings Inc.
- Klarna Bank AB
- Meta Platforms Inc. (Meta Pay)
- Fiserv Inc. (Carat, Clover)
Additional Benefits:
- The market estimate (ME) sheet in Excel format
- 3 months of analyst support
TABLE OF CONTENTS
1 INTRODUCTION
- 1.1 Study Assumptions and Market Definition
- 1.2 Scope of the Study
2 RESEARCH METHODOLOGY
3 EXECUTIVE SUMMARY
4 MARKET LANDSCAPE
- 4.1 Market Overview
- 4.2 Market Drivers
- 4.2.1 Rising Smartphone and 5G Penetration
- 4.2.2 Rapid Merchant Roll-out of NFC/contactless Terminals
- 4.2.3 P2P Wallet Adoption Surge (Zelle, Venmo, Cash App)
- 4.2.4 Expansion of FedNow and RTP Instant Rails
- 4.2.5 Tokenised Card-on-file Reduces Fraud and Boosts Acceptance
- 4.2.6 Earned-wage Access Fueling Push-to-wallet Payroll
- 4.3 Market Restraints
- 4.3.1 Data-security and Privacy Concerns
- 4.3.2 Credit/debit Card Rewards Lock-in
- 4.3.3 Patchwork State-level Privacy Laws Raise Compliance Cost
- 4.3.4 Wallet / bank-rail Interoperability Gaps Cause Liquidity Silos
- 4.4 Impact of Macroeconomic Factors
- 4.5 Industry Value Chain Analysis
- 4.6 Regulatory Landscape
- 4.7 Technological Outlook
- 4.8 Porter's Five Forces Analysis
- 4.8.1 Threat of New Entrants
- 4.8.2 Bargaining Power of Suppliers
- 4.8.3 Bargaining Power of Buyers/Consumers
- 4.8.4 Threat of Substitute Products
- 4.8.5 Intensity of Competitive Rivalry
- 4.9 Analysis of Business Models
- 4.10 Mobile-Wallet Penetration Analysis
- 4.11 Enabling Technologies Analysis (NFC, QR, BLE)
- 4.12 Mobile-Commerce Growth Commentary
5 MARKET SIZE AND GROWTH FORECASTS (VALUE)
- 5.1 By Payment Instrument
- 5.1.1 Real-Time Transfers (RTP/FedNow)
- 5.1.2 Mobile Wallets (Apple Pay, PayPal, etc.)
- 5.1.3 Card-based Mobile Payments
- 5.1.4 Carrier Billing / Others
- 5.2 By Transaction Channel
- 5.2.1 In-store POS
- 5.2.2 E-commerce
- 5.2.3 P2P Transfers
- 5.2.4 Bill and Government Payments
- 5.2.5 Cross-border / Tourist
- 5.3 By Payment Type
- 5.3.1 Proximity Payments
- 5.3.2 Remote Payments
- 5.4 By End-User Industry
- 5.4.1 Retail and FMCG
- 5.4.2 Transportation and Mobility
- 5.4.3 Hospitality and Tourism
- 5.4.4 Utilities and Telecom
- 5.4.5 Healthcare and Education
- 5.4.6 Other End-User Industries
6 COMPETITIVE LANDSCAPE
- 6.1 Market Concentration
- 6.2 Strategic Moves
- 6.3 Market Share Analysis
- 6.4 Company Profiles {(includes Global level Overview, Market level overview, Core Segments, Financials as available, Strategic Information, Market Rank/Share for key companies, Products and Services, and Recent Developments)}
- 6.4.1 Apple Inc.
- 6.4.2 PayPal Holdings Inc.
- 6.4.3 Block Inc.
- 6.4.4 Google LLC (Google Pay)
- 6.4.5 Early Warning Services LLC (Zelle)
- 6.4.6 Samsung Electronics Co., Ltd.
- 6.4.7 JPMorgan Chase and Co. (Chase Pay)
- 6.4.8 Microsoft Corp. (Microsoft Pay)
- 6.4.9 Mastercard Inc. (Click to Pay)
- 6.4.10 Visa Inc. (Visa Direct / Click to Pay)
- 6.4.11 Stripe Inc.
- 6.4.12 Amazon.com Inc. (Amazon Pay)
- 6.4.13 Walmart Inc. (Walmart Pay)
- 6.4.14 Garmin Ltd.
- 6.4.15 Cash App
- 6.4.16 BitPay Inc.
- 6.4.17 Affirm Holdings Inc.
- 6.4.18 Klarna Bank AB
- 6.4.19 Meta Platforms Inc. (Meta Pay)
- 6.4.20 Fiserv Inc. (Carat, Clover)
7 MARKET OPPORTUNITIES AND FUTURE OUTLOOK
- 7.1 White-space and Unmet-Need Assessment

