
PUBLISHER: Mordor Intelligence | PRODUCT CODE: 2073636

PUBLISHER: Mordor Intelligence | PRODUCT CODE: 2073636
Power Equipment - Market Share Analysis, Industry Trends & Statistics, Growth Forecasts (2026 - 2031)
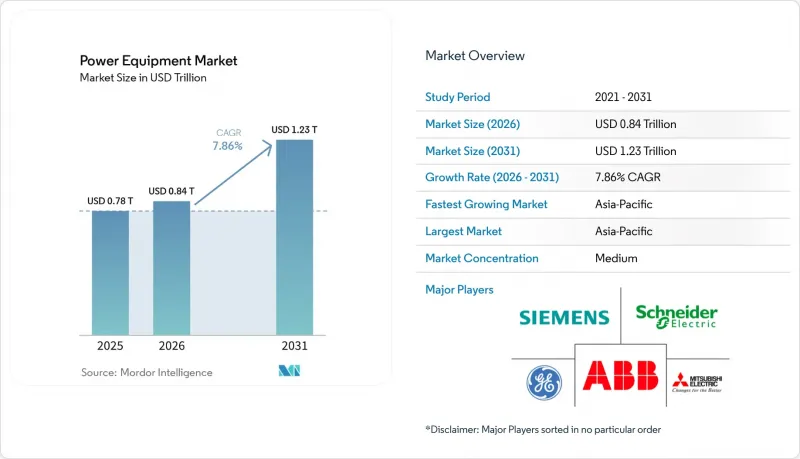
According to Mordor Intelligence, the power equipment market size was valued at USD 0.78 trillion in 2025 and is estimated to grow from USD 0.84 trillion in 2026 to reach USD 1.23 trillion by 2031, at a CAGR of 7.86% during the forecast period (2026-2031).
This report is Segmented by Equipment Type (Turbines, Transformers, Switchgears, Power Cables, and More), Power Generation Source (Thermal, Nuclear, and Renewables), Voltage Class (Up To 1 KV, 1 To 36 KV, and Above 36 KV), Application (Power Generation, Transmission, and Distribution), End-User (Residential, Industrial, Commercial, and Utility), and Geography (North America, Europe, Asia-Pacific, and More).
Global Power Equipment Market Trends and Insights
Rapid Renewable-Led Grid Modernization
Global operators are refitting networks to manage voltage fluctuations and reverse fault currents introduced by solar and wind inverters. IEA data show 507 gigawatts of renewable capacity came online in 2024, with USD 600 billion in grid reinforcements needed by 2030. Transformer suppliers now integrate sub-second tap-changers, while switchgear vendors deploy arc-suppression modules that address bidirectional currents. Siemens Energy reported a 34% year-on-year rise in grid-stabilization orders in 2025, driven by North Sea offshore wind and Australia's solar-plus-storage build-outs. IEEE 1547-2018 ride-through compliance has become the baseline for North American procurement, forcing vendors to certify anti-islanding features. These requirements are pushing R&D budgets toward interoperability rather than raw efficiency.
Urbanization-Fuelled Infrastructure Expansion in Emerging Economies
The United Nations projects India, Indonesia, and Nigeria will add 420 million urban residents between 2024 and 2035, demanding 280 gigawatts of new capacity. India's Power Grid Corporation awarded USD 4.2 billion of 765-kilovolt contracts in 2025, while Indonesia's PLN is procuring 15,000 distribution transformers annually through 2030. ABB opened a 50,000-square-meter transformer facility in Bengaluru in June 2025 to satisfy local-content rules. Suppliers are engineering cost-optimized products with shorter lead times, emphasizing volume over incremental efficiency.
Volatile Copper & Rare-Earth Supply Chains
Copper prices swung between USD 9,100 and USD 10,850 per ton from 2024 to mid-2026, creating 15%-18% bill-of-materials variance for transformers. Neodymium oxide spiked to USD 94,000 per ton in early 2025 as Chinese export quotas tightened. GE redesigned generator rotors with lower rare-earth content to offset a 220-basis-point margin squeeze reported in 2025 filings. Western governments issued USD 2.8 billion of grants in 2025 for domestic refining, but commercial output will not arrive before 2028. Vendors are trialing copper-aluminum hybrids and ferrite magnets, trading some efficiency for cost predictability.
Other drivers and restraints analyzed in the detailed report include:
- Hyperscale Data-Center Back-Up Power Build-Out
- Rural Electrification & Mini-Grids
- Cyber-Security Certification Delays for Smart Switchgear
For complete list of drivers and restraints, kindly check the Table Of Contents.
Segment Analysis
Turbines captured 27.1% of 2025 revenue, underpinning the largest slice of the power equipment market share, and they are set to expand at a 9.2% CAGR through 2031. Mitsubishi Power won a USD 1.1 billion order in February 2025 for six M701JAC units supporting Texas solar variability. Generators, particularly hydrogen-ready reciprocating sets, are scaling in off-grid mines and data-center campuses. Meanwhile, transformers face a two-track future: sub-36-kilovolt distribution models supply urban networks, whereas 100 MVA-plus power units feed ultra-high-voltage corridors. Switchgear is transitioning to solid-state interruption, evidenced by ABB's 2024 acquisition of a software-defined protection firm. HVDC subsea cables are booming, as Prysmian's EUR 8 billion backlog indicates.
Digitally enabled sensors embedded across these products generate predictive insights that shorten outage durations and cut O&M budgets. Edge analytics allow utilities to defer costly replacements, while manufacturers monetize data via subscription dashboards, reinforcing recurring-revenue profiles that underpin the broader power equipment market.
Renewables claimed 61.2% of 2025 demand and are forecast for a 12.4% CAGR, shifting design targets from capacity to controllability. Transformers now require broader voltage-regulation bands, and circuit breakers must clear bidirectional faults. Thermal plants are pivoting to flexible peakers; Siemens Energy's HL-class ramps from 0% to 100% in under 10 minutes. Nuclear's small modular reactors will necessitate radiation-tolerant switchgear by 2028.
Solar farms deploy distributed medium-voltage gear, while offshore wind hinges on subsea cables and floating substations. Carbon-capture retrofits add auxiliary loads, compelling uprated generators. Nuclear relicensing cycles drive digital control upgrades compliant with NRC cyber rules. Consequently, equipment architecture has become fuel-agnostic, emphasizing integration over type.
Complete Report Scope:
- By Equipment Type
- Turbines
- Generators
- Transformers
- Switchgear
- Circuit Breakers
- Power Cables
- Other Equipment (Transmission Towers, Voltage Regulators, Insulators, Capacitors, Shunt Reactor, Relays, Substation Structures, etc.)
- By Power Generation Source
- Thermal
- Nuclear
- Renewables
- By Voltage Class
- Up to 1 kV
- 1 to 36 kV
- Above 36 kV
- By Application
- Power Generation
- Transmission
- Distribution
- By End-User
- Residential
- Commercial
- Industrial
- Utility
- By Geography
- North America
- United States
- Canada
- Mexico
- Europe
- Germany
- France
- United Kingdom
- Italy
- NORDIC Countries
- Russia
- Rest of Europe
- Asia-Pacific
- China
- India
- Japan
- South Korea
- ASEAN Countries
- Australia and New Zealand
- Rest of Asia-Pacific
- South America
- Brazil
- Argentina
- Chile
- Rest of South America
- Middle East and Africa
- Saudi Arabia
- United Arab Emirates
- South Africa
- Egypt
- Rest of Middle East and Africa
- North America
Geography Analysis
Asia-Pacific held 50.4% of global revenue in 2025 and will sustain a 9.0% CAGR, propelled by China's +-800 kV corridors, India's renewables auctions, and ASEAN coal-to-gas conversions. State Grid invested USD 58 billion in 2024, emphasizing long-haul HVDC to coastal load centers. India auctioned 50 gigawatts of renewables in 2024, triggering USD 12 billion of evacuation contracts. Japan's 1.2 gigawatt Chiba offshore wind farm, awarded in 2025, requires floating substations and 66 kV cables. South Korea's Green New Deal budgets KRW 73.4 trillion through 2030 for digital substations. ASEAN nations secured USD 4.2 billion in ADB transmission funding in 2025.
North America and Europe prioritize grid resilience. The U.S. Inflation Reduction Act's tax credits catalyze projects like the 3 GW TransWest Express line. Germany approved EUR 24 billion of expansion in 2025, including SuedLink. The UK road-mapped 4,000 km of offshore circuits costing GBP 18 billion. Nordic states expand cross-border connectors such as the EUR 1.3 billion NordLink.
South America and the Middle East show rising opportunity. Brazil auctioned 15 GW of concessions in 2024, drawing Siemens Energy and WEG bids. Chile's Atacama solar corridor employs 500 kV lines commissioned in 2025. Saudi Arabia earmarked USD 7.5 billion in 2024 for renewable transmission under PIF. DEWA let a USD 1.8 billion 400 kV contract in 2025 for the MBR Solar Park integration. Off-grid African mini-grids financed by the World Bank round out demand diversity.
- General Electric
- Siemens AG
- Schneider Electric
- Mitsubishi Electric
- Eaton
- ABB
- Toshiba
- Honeywell
- Bharat Heavy Electricals
- Crompton Greaves
- Larsen & Toubro
- Fuji Electric
- Rockwell Automation
- Cummins
- Caterpillar
- Kohler
- Generac Holdings
- Hitachi Energy
- WEG SA
- Siemens Energy
Additional Benefits:
- The market estimate (ME) sheet in Excel format
- 3 months of analyst support
TABLE OF CONTENTS
1 Introduction
- 1.1 Study Assumptions & Market Definition
- 1.2 Scope of the Study
2 Research Methodology
3 Executive Summary
4 Market Landscape
- 4.1 Market Overview
- 4.2 Market Drivers
- 4.2.1 Rapid renewable-led grid modernization
- 4.2.2 Urbanization-fuelled infrastructure expansion in emerging economies
- 4.2.3 Hyperscale data-centre back-up power build-out
- 4.2.4 Rural electrification & mini-grids in Africa-Asia
- 4.2.5 Rise of peer-to-peer micro-grids needing bi-directional switchgear
- 4.2.6 "Equipment-as-a-Service" subscription models lowering capex
- 4.3 Market Restraints
- 4.3.1 High O&M cost of legacy fleets
- 4.3.2 Volatile copper & rare-earth supply chains
- 4.3.3 Cyber-security certification delays for smart switchgear
- 4.3.4 Inverter-based resources reducing transformer demand
- 4.4 Supply-Chain Analysis
- 4.5 Regulatory Landscape
- 4.6 Technological Outlook
- 4.7 Porter's Five Forces
- 4.7.1 Bargaining Power of Suppliers
- 4.7.2 Bargaining Power of Buyers
- 4.7.3 Threat of New Entrants
- 4.7.4 Threat of Substitutes
- 4.7.5 Competitive Rivalry
5 Market Size & Growth Forecasts
- 5.1 By Equipment Type
- 5.1.1 Turbines
- 5.1.2 Generators
- 5.1.3 Transformers
- 5.1.4 Switchgear
- 5.1.5 Circuit Breakers
- 5.1.6 Power Cables
- 5.1.7 Other Equipment (Transmission Towers, Voltage Regulators, Insulators, Capacitors, Shunt Reactor, Relays, Substation Structures, etc.)
- 5.2 By Power Generation Source
- 5.2.1 Thermal
- 5.2.2 Nuclear
- 5.2.3 Renewables
- 5.3 By Voltage Class
- 5.3.1 Up to 1 kV
- 5.3.2 1 to 36 kV
- 5.3.3 Above 36 kV
- 5.4 By Application
- 5.4.1 Power Generation
- 5.4.2 Transmission
- 5.4.3 Distribution
- 5.5 By End-User
- 5.5.1 Residential
- 5.5.2 Commercial
- 5.5.3 Industrial
- 5.5.4 Utility
- 5.6 By Geography
- 5.6.1 North America
- 5.6.1.1 United States
- 5.6.1.2 Canada
- 5.6.1.3 Mexico
- 5.6.2 Europe
- 5.6.2.1 Germany
- 5.6.2.2 France
- 5.6.2.3 United Kingdom
- 5.6.2.4 Italy
- 5.6.2.5 NORDIC Countries
- 5.6.2.6 Russia
- 5.6.2.7 Rest of Europe
- 5.6.3 Asia-Pacific
- 5.6.3.1 China
- 5.6.3.2 India
- 5.6.3.3 Japan
- 5.6.3.4 South Korea
- 5.6.3.5 ASEAN Countries
- 5.6.3.6 Australia and New Zealand
- 5.6.3.7 Rest of Asia-Pacific
- 5.6.4 South America
- 5.6.4.1 Brazil
- 5.6.4.2 Argentina
- 5.6.4.3 Chile
- 5.6.4.4 Rest of South America
- 5.6.5 Middle East and Africa
- 5.6.5.1 Saudi Arabia
- 5.6.5.2 United Arab Emirates
- 5.6.5.3 South Africa
- 5.6.5.4 Egypt
- 5.6.5.5 Rest of Middle East and Africa
- 5.6.1 North America
6 Competitive Landscape
- 6.1 Market Concentration
- 6.2 Strategic Moves (M&A, Partnerships, PPAs)
- 6.3 Market Share Analysis (Market Rank/Share for key companies)
- 6.4 Company Profiles (includes Global level Overview, Market level overview, Core Segments, Financials as available, Strategic Information, Products & Services, and Recent Developments)
- 6.4.1 General Electric
- 6.4.2 Siemens AG
- 6.4.3 Schneider Electric
- 6.4.4 Mitsubishi Electric
- 6.4.5 Eaton
- 6.4.6 ABB
- 6.4.7 Toshiba
- 6.4.8 Honeywell
- 6.4.9 Bharat Heavy Electricals
- 6.4.10 Crompton Greaves
- 6.4.11 Larsen & Toubro
- 6.4.12 Fuji Electric
- 6.4.13 Rockwell Automation
- 6.4.14 Cummins
- 6.4.15 Caterpillar
- 6.4.16 Kohler
- 6.4.17 Generac Holdings
- 6.4.18 Hitachi Energy
- 6.4.19 WEG SA
- 6.4.20 Siemens Energy
7 Market Opportunities & Future Outlook
- 7.1 White-space & Unmet-need Assessment

