
PUBLISHER: Mordor Intelligence | PRODUCT CODE: 2097234

PUBLISHER: Mordor Intelligence | PRODUCT CODE: 2097234
Speaker In Tablets - Market Share Analysis, Industry Trends & Statistics, Growth Forecasts (2026 - 2031)
According to Mordor Intelligence, the speaker market size in tablets size in 2026 is estimated at USD 578.81 million, growing from 2025 value of USD 558.27 million with 2031 projections showing USD 693.47 million, growing at 3.68% CAGR over 2026-2031.
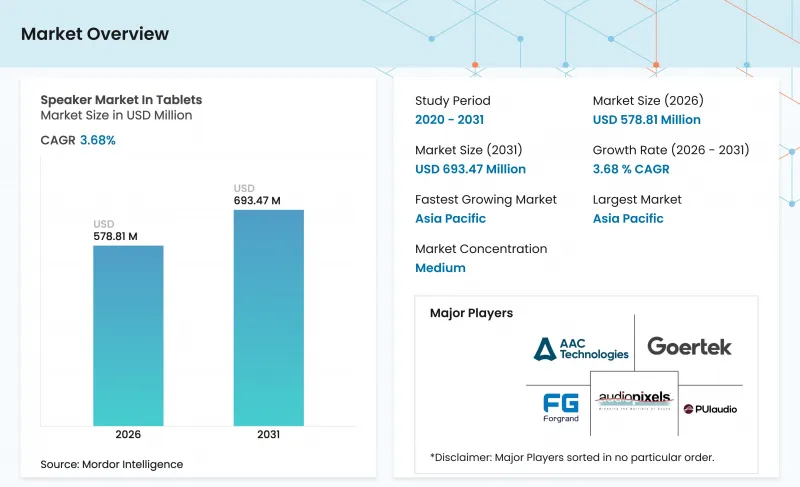
This report is Segmented by Product Type (Dynamic Speakers, Balanced Armature Speakers, and More), Driver Size (Less Than 15 Mm, 15-25 Mm, and Greater Than 25 Mm), Application (Consumer/Personal, Education, Enterprise/Industrial, and Gaming/Cloud-gaming Tablets), Sales Channel (OEM Integrated, and After-market/Replacement), and Geography. The Market Forecasts are Provided in Terms of Value (USD).
Insights and Trends of Speaker Market In Tablets
Work-from-home and e-learning surge
Hybrid work has hardened into standard practice for many corporations; weekly video-meeting hours remain 54 % above the 2019 baseline, so tablet acoustics matter more than ever for intelligible speech. Simultaneously, public-sector education ministries in India, Indonesia, and Thailand budget for millions of classroom tablets, each with minimum loudness specs to accommodate group listening. Indian ed-tech investment nearly doubled to USD 164 million in H1 2024, signaling durable hardware procurement. Those parallel streams-enterprise and classroom-underwrite steady unit volumes even when consumer refresh cycles lengthen.
High-resolution streaming audio demand
Lossless catalogs on Apple Music and Amazon Music HD prime consumers to expect full-range fidelity from every mobile screen. The Japan Audio Society's Hi-Res Audio seal rapidly appears on premium tablets, nudging OEMs to adopt wide-bandwidth speaker modules. Bluetooth LE Audio and aptX Adaptive codecs preserve that fidelity wirelessly, so distortion in built-in speakers becomes a purchase deterrent. Resulting upgrades in enclosure volume and tweeter count keep average selling prices buoyant inside the speaker market in tablets.
Smartphone substitution effect
Average smartphone diagonals now hit 6.8 inches, encroaching on small-tablet territory and reducing the need for a second screen. Flagship handsets ship with dual speakers and virtual surround, shrinking the acoustic delta versus tablets. This erosion is most acute in mature markets, shaving 0.9 percentage points off the projected CAGR for the speaker market in tablets.
Other drivers and restraints analyzed in the detailed report include:
- MEMS micro-speaker design breakthroughs
- Spatial-audio tablet design adoption
- Inflation and supply-chain volatility
For complete list of drivers and restraints, kindly check the Table Of Contents.
Segment Analysis
Dynamic speakers still hold 45.68% of the speaker market in tablets share, equivalent to USD 254.93 million in 2025 revenue, leveraging decades-old supply chains and cost-optimized coil-magnet architectures. MEMS micro-speakers, now expected to grow 4.71% CAGR, gain design wins in ultrathin detachables and premium e-readers where every millimeter counts. Balanced-armature units serve voice-first productivity tablets that emphasize mid-band clarity, whereas electrostatic options remain the high-cost, audiophile niche.
The competitive interplay intensifies as MEMS suppliers achieve BOM parity by 2027. Dynamic vendors counter with shorter air-gap magnets and LCP diaphragms to extend bandwidth without raising depth. OEMs likely continue splitting portfolios: dynamic for cost-sensitive SKUs, MEMS for halo models, each side reinforcing the speaker market in tablets rather than cannibalizing it.
Drivers between 15 mm and 25 mm controlled 51.05% of the 2025 shipment value, balancing enclosure volume with bass reach. Yet the less-than-15 mm class will pace the field at a 4.92% CAGR, aided by spatial-audio tablets that stack multiple small drivers for beamforming. IEEE modeling shows a 3 mm diameter cut doubles cone excursion at equal SPL, but MEMS designs offset this with rigid silicon diaphragms. Larger-than-25 mm units persist in performance slates, though weight penalties limit mainstream adoption.
Complete Report Scope:
- By Product Type
- Dynamic Speakers
- Balanced Armature Speakers
- MEMS Micro Speakers
- Electrostatic Speakers
- By Driver Size
- Less than 15 mm
- 15 - 25 mm
- Greater than 25 mm
- By Application
- Consumer / Personal
- Education
- Enterprise / Industrial
- Gaming / Cloud-gaming Tablets
- By Sales Channel
- OEM Integrated
- After-market / Replacement
- By Geography
- North America
- United States
- Canada
- Mexico
- South America
- Brazil
- Argentina
- Colombia
- Rest of South America
- Europe
- United Kingdom
- Germany
- France
- Italy
- Spain
- Rest of Europe
- Asia-Pacific
- China
- Japan
- South Korea
- India
- Rest of Asia-Pacific
- Middle East and Africa
- Middle East
- Saudi Arabia
- United Arab Emirates
- Rest of Middle East
- Africa
- South Africa
- Egypt
- Rest of Africa
- Middle East
- North America
Geography Analysis
Asia-Pacific accounted for 38.12% of 2025 revenue, equal to USD 212.78 million, and is forecast to grow 6.62% CAGR. Chinese OEMs posted 73.1% shipment expansion for Xiaomi and 29.3% for Huawei, reinforcing the region's dominance. India's "PM eVidya" digital-classroom plan earmarks USD 1.1 billion through 2027, ensuring rolling tenders for speaker-equipped tablets. Component clusters in Shenzhen and Suzhou shorten design cycles, enabling rapid MEMS integration once costs align.
North America remains the value leader in premium tiers. Consumers here gravitate to iPad-class acoustics and early spatial-audio rollouts. ASPs sit 22 % above global norms, cushioning suppliers from volume fluctuations. Local MEMS startups partner with U.S. fabs to secure Defense Production Act incentives, seeding new capacity for 2026-2028.
Europe mirrors North America's premium preference but layers in eco-design mandates. OEMs must document magnet provenance and recyclability per the EU Circular Electronics Initiative, nudging them toward wafer-level MEMS parts that simplify end-of-life teardown. Latin America and the Middle East and Africa remain volume-light yet gains can be lumpy; Brazil's EduTech program and Saudi Arabia's Vision 2030 both feature multimedia tablets, creating batch procurement spikes.
- AAC Technologies Holdings Inc.
- Goertek Inc.
- Merry Electronics Co., Ltd.
- Foster Electric Co., Ltd.
- Knowles Corporation
- Fortune Grand Technology Inc.
- Shandong Gettop Acoustic Co., Ltd.
- Panasonic Corporation
- TDK Corporation
- BSE Co., Ltd.
- Sonion A/S
- Hon Hai Precision Industry Co., Ltd.
- Luxshare Precision Industry Co., Ltd.
- Shenzhen Sunway Communication Co., Ltd.
- DB Unlimited
- PUI Audio, Inc.
- Audio Pixels Holdings Ltd.
- Bose Corporation
- Harman International Industries, Inc.
- Lepai Technology Co., Ltd.
Additional Benefits:
- The market estimate (ME) sheet in Excel format
- 3 months of analyst support
TABLE OF CONTENTS
1 INTRODUCTION
- 1.1 Study Assumptions and Market Definition
- 1.2 Scope of the Study
2 RESEARCH METHODOLOGY
3 EXECUTIVE SUMMARY
4 MARKET LANDSCAPE
- 4.1 Market Overview
- 4.2 Market Drivers
- 4.2.1 Work-From-Home and E-Learning Surge
- 4.2.2 High-Resolution Streaming Audio Demand
- 4.2.3 MEMS Micro-Speaker Design Breakthroughs
- 4.2.4 Spatial-Audio Tablet Design Adoption
- 4.2.5 Emerging-Market Digital Classroom Subsidies
- 4.2.6 Growth of Gaming-Centric Detachable Tablets
- 4.3 Market Restraints
- 4.3.1 Smartphone Substitution Effect
- 4.3.2 Inflation And Supply-Chain Volatility
- 4.3.3 Shift to Wireless Earbuds
- 4.3.4 Ultra-Thin Bezel Acoustic Limits
- 4.4 Industry Supply Chain Analysis
- 4.5 Regulatory Landscape
- 4.6 Technological Outlook
- 4.7 Porter's Five Forces Analysis
- 4.7.1 Bargaining Power of Suppliers
- 4.7.2 Bargaining Power of Buyers
- 4.7.3 Threat of New Entrants
- 4.7.4 Threat of Substitutes
- 4.7.5 Degree of Competition
- 4.8 Assessment of Macroeconomic Impact
5 MARKET SIZE AND GROWTH FORECASTS (VALUE)
- 5.1 By Product Type
- 5.1.1 Dynamic Speakers
- 5.1.2 Balanced Armature Speakers
- 5.1.3 MEMS Micro Speakers
- 5.1.4 Electrostatic Speakers
- 5.2 By Driver Size
- 5.2.1 Less than 15 mm
- 5.2.2 15 - 25 mm
- 5.2.3 Greater than 25 mm
- 5.3 By Application
- 5.3.1 Consumer / Personal
- 5.3.2 Education
- 5.3.3 Enterprise / Industrial
- 5.3.4 Gaming / Cloud-gaming Tablets
- 5.4 By Sales Channel
- 5.4.1 OEM Integrated
- 5.4.2 After-market / Replacement
- 5.5 By Geography
- 5.5.1 North America
- 5.5.1.1 United States
- 5.5.1.2 Canada
- 5.5.1.3 Mexico
- 5.5.2 South America
- 5.5.2.1 Brazil
- 5.5.2.2 Argentina
- 5.5.2.3 Colombia
- 5.5.2.4 Rest of South America
- 5.5.3 Europe
- 5.5.3.1 United Kingdom
- 5.5.3.2 Germany
- 5.5.3.3 France
- 5.5.3.4 Italy
- 5.5.3.5 Spain
- 5.5.3.6 Rest of Europe
- 5.5.4 Asia-Pacific
- 5.5.4.1 China
- 5.5.4.2 Japan
- 5.5.4.3 South Korea
- 5.5.4.4 India
- 5.5.4.5 Rest of Asia-Pacific
- 5.5.5 Middle East and Africa
- 5.5.5.1 Middle East
- 5.5.5.1.1 Saudi Arabia
- 5.5.5.1.2 United Arab Emirates
- 5.5.5.1.3 Rest of Middle East
- 5.5.5.2 Africa
- 5.5.5.2.1 South Africa
- 5.5.5.2.2 Egypt
- 5.5.5.2.3 Rest of Africa
- 5.5.5.1 Middle East
- 5.5.1 North America
6 COMPETITIVE LANDSCAPE
- 6.1 Market Concentration
- 6.2 Strategic Moves
- 6.3 Market Share Analysis
- 6.4 Company Profiles (includes Global level Overview, Market level overview, Core Segments, Financials as available, Strategic Information, Market Rank/Share for key companies, Products and Services, and Recent Developments)
- 6.4.1 AAC Technologies Holdings Inc.
- 6.4.2 Goertek Inc.
- 6.4.3 Merry Electronics Co., Ltd.
- 6.4.4 Foster Electric Co., Ltd.
- 6.4.5 Knowles Corporation
- 6.4.6 Fortune Grand Technology Inc.
- 6.4.7 Shandong Gettop Acoustic Co., Ltd.
- 6.4.8 Panasonic Corporation
- 6.4.9 TDK Corporation
- 6.4.10 BSE Co., Ltd.
- 6.4.11 Sonion A/S
- 6.4.12 Hon Hai Precision Industry Co., Ltd.
- 6.4.13 Luxshare Precision Industry Co., Ltd.
- 6.4.14 Shenzhen Sunway Communication Co., Ltd.
- 6.4.15 DB Unlimited
- 6.4.16 PUI Audio, Inc.
- 6.4.17 Audio Pixels Holdings Ltd.
- 6.4.18 Bose Corporation
- 6.4.19 Harman International Industries, Inc.
- 6.4.20 Lepai Technology Co., Ltd.
7 MARKET OPPORTUNITIES AND FUTURE OUTLOOK
- 7.1 White-space and Unmet-need Assessment

