PUBLISHER: Mordor Intelligence | PRODUCT CODE: 2097243

PUBLISHER: Mordor Intelligence | PRODUCT CODE: 2097243
Testing, Inspection, and Certification for the Transportation Industry - Market Share Analysis, Industry Trends & Statistics, Growth Forecasts (2026 - 2031)
According to Mordor Intelligence, the testing, inspection, and certification market size for the transportation industry was valued at USD 5.87 billion in 2025 and estimated to grow from USD 6.12 billion in 2026 to reach USD 7.56 billion by 2031, at a CAGR of 4.33% during the forecast period (2026-2031).
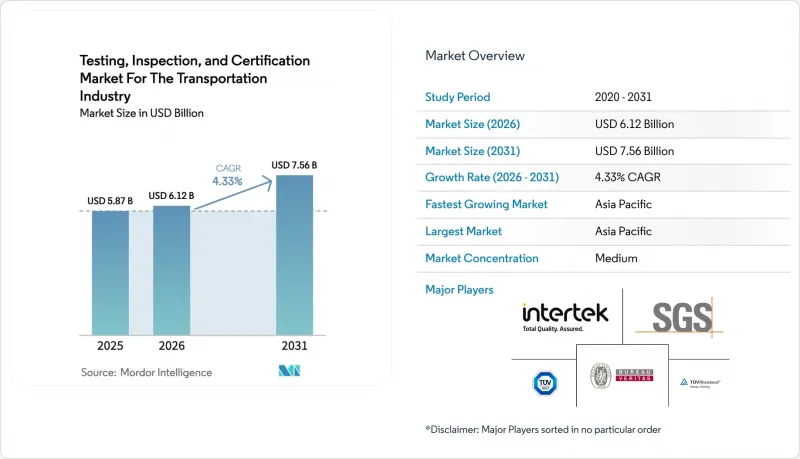
This report is Segmented by Service Type (Testing Services, Inspection Services, and Certification Services), Sourcing Type (In-House and Outsourced), and Geography (North America, South America, Europe, Asia-Pacific, and the Middle East and Africa). The Market Forecasts are Provided in Terms of Value (USD).
Global Testing, Inspection, and Certification for the Transportation Industry Trends and Insights
Increasing Regulatory Stringency For Transportation Safety And Emissions
Worldwide emissions and safety rules adopted in 2024 tightened compliance thresholds, notably Euro 7's real-world emissions monitoring scheme and China's GB 9743-2024 and GB 9744-2024 tire standards. The UN Economic Commission for Europe's WP.29 forum accelerated harmonization so that manufacturers can certify across multiple jurisdictions via a single test suite. Outcome-based metrics now dominate, letting laboratories design innovative test procedures that capture real-life duty cycles. Global uptake of ISO 26262 functional safety for autonomous driving raised demand for highly specialized validation-often priced at a premium because liability risk is significant.
Rapid Adoption Of EV And Autonomous Vehicles Needing New Test Protocols
UL 2580 revisions added thermal-runaway benchmarks, and ISO 6469 broadened its scope to solid-state batteries planned for release after 2027. Autonomous standards under SAE J3018 and ISO/TS 5083:2025 mandate multi-layered sensor, algorithm, and cybersecurity tests, lengthening validation cycles but driving higher revenue per project. Vehicle-to-grid interface testing became a standalone service line in 2024 as utilities demanded proof of bidirectional safety.
High Compliance Testing Costs For SMEs
European Commission studies found that small suppliers now spend EUR 50,000-100,000 (USD 53,500-107,000) each year on vehicle testing, an outlay that strains working capital. Battery laboratories cost USD 2-5 million to build, raising entry barriers for new providers. Lengthy certification timelines lock up cash before product launch, forcing many SMEs to adopt collaborative or subscription models.
Other drivers and restraints analyzed in the detailed report include:
- Emergence Of Digital Twins Enabling Continuous Remote Inspection
- Rise Of Fleet-As-A-Service Models Outsourcing Compliance
- Shortage Of Qualified NDT Professionals
For complete list of drivers and restraints, kindly check the Table Of Contents.
Segment Analysis
Testing services generated the largest share, reflecting mandatory multi-stage validation from component to full-vehicle homologation. Within the Testing, Inspection, and Certification for the Transportation Industry size, testing captured 58.92% in 2025, thanks to battery abuse tests and ADAS verification. Certification, however, is set to accelerate at a 4.88% CAGR as outcome-based standards spur demand for digital certificates that regulators can audit remotely. The shift also boosts margins because ISO 26262 and ISO 21434 cybersecurity sign-offs command premium fees.
Inspection remains a steady but slower-growing line. Remote monitoring and automated camera systems cut repetitive physical checks, depressing growth relative to testing and certification. Providers are retooling inspection portfolios around exception-based models where algorithms flag only non-conforming vehicles for manual review, preserving relevance while controlling cost.
Complete Report Scope:
- By Service Type
- Testing Services
- Inspection Services
- Certification Services
- By Sourcing Type
- In-house
- Outsourced
- By Geography
- North America
- United States
- Canada
- Mexico
- South America
- Brazil
- Argentina
- Rest of South America
- Europe
- Germany
- United Kingdom
- France
- Italy
- Spain
- Russia
- Rest of Europe
- Asia-Pacific
- China
- Japan
- India
- South Korea
- South-East Asia
- Rest of Asia-Pacific
- Middle East and Africa
- Middle East
- Saudi Arabia
- United Arab Emirates
- Turkey
- Rest of Middle East
- Africa
- South Africa
- Nigeria
- Rest of Africa
- Middle East
- North America
Geography Analysis
Asia-Pacific dominated the Testing, Inspection, and Certification for the Transportation Industry in 2025, with 39.12% revenue, and is poised for the fastest 5.18% CAGR through 2031. China's GB 38031-2020 battery safety and aggressive NEV quotas generate steady lab utilization, while India's move toward advanced driver assistance system testing under Bharat NCAP 2.0 attracts foreign TIC investment. Japan and South Korea add high-value demand tied to solid-state batteries and autonomous shuttles, though their mature vehicle bases temper volume growth.
North America follows with stringent Federal Motor Vehicle Safety Standards and heightened emphasis on connected-car cybersecurity, creating specialty test demand at premium rates. U.S. fleet operators account for sizeable, outsourced inspection volumes after the 2024 FMCSA update tightened commercial vehicle oversight.
Europe remains robust, benefiting from WP.29 harmonization and the imminent Euro 7 rollout that necessitates real-world emissions verification. Laboratories there tout large capacity for portable emissions measurements and battery fire-containment tests that serve both domestic and trans-Atlantic manufacturers.
The Middle East and Africa, and South America are emerging theaters. Gulf Cooperation Council states are aligning rules with UN regulations, while Brazil's domestic production base and Mercosur trading bloc encourage regional providers to scale. Currency volatility and infrastructure gaps still limit near-term penetration but offer a long-run upside as standards converge.
- SGS SA
- Bureau Veritas SA
- Intertek Group plc
- DEKRA SE
- TUV SUD AG
- TUV Rheinland Group
- Applus Services SA
- DNV AS
- Lloyd's Register Group Ltd
- Element Materials Technology Group
- ALS Limited
- Eurofins Scientific SE
- UL LLC
- MISTRAS Group Inc.
- Kiwa N.V.
- CSA Group
- Control Union Certifications B.V.
- RINA S.p.A.
- NSF International
- BSI Group
- TUV NORD AG
- PONY Testing International Group
- ABS Group of Companies Inc.
- Vicom Ltd
- CCIC (China Certification and Inspection Group)
Additional Benefits:
- The market estimate (ME) sheet in Excel format
- 3 months of analyst support
TABLE OF CONTENTS
1 INTRODUCTION
- 1.1 Study Assumptions and Market Definition
- 1.2 Scope of the Study
2 RESEARCH METHODOLOGY
3 EXECUTIVE SUMMARY
4 MARKET LANDSCAPE
- 4.1 Market Overview
- 4.2 Market Drivers
- 4.2.1 Increasing regulatory stringency for transportation safety and emissions
- 4.2.2 Growth in global trade boosting vehicle inspection demand
- 4.2.3 Rapid adoption of EV and autonomous vehicles needing new test protocols
- 4.2.4 Aging transport infrastructure requiring regular inspection
- 4.2.5 Emergence of digital twins enabling continuous remote inspection
- 4.2.6 Rise of fleet-as-a-service models outsourcing compliance
- 4.3 Market Restraints
- 4.3.1 High compliance testing costs for SMEs
- 4.3.2 Fragmented regulatory frameworks across regions
- 4.3.3 AI-based self-diagnostics reducing third-party testing reliance
- 4.3.4 Shortage of qualified NDT professionals
- 4.4 Industry Value Chain Analysis
- 4.5 Impact of Macroeconomic Factors
- 4.6 Regulatory Landscape
- 4.7 Technological Outlook
- 4.8 Porter's Five Forces Analysis
- 4.8.1 Bargaining Power of Suppliers
- 4.8.2 Bargaining Power of Buyers
- 4.8.3 Threat of New Entrants
- 4.8.4 Threat of Substitutes
- 4.8.5 Competitive Rivalry
5 MARKET SIZE AND GROWTH FORECASTS (VALUE)
- 5.1 By Service Type
- 5.1.1 Testing Services
- 5.1.2 Inspection Services
- 5.1.3 Certification Services
- 5.2 By Sourcing Type
- 5.2.1 In-house
- 5.2.2 Outsourced
- 5.3 By Geography
- 5.3.1 North America
- 5.3.1.1 United States
- 5.3.1.2 Canada
- 5.3.1.3 Mexico
- 5.3.2 South America
- 5.3.2.1 Brazil
- 5.3.2.2 Argentina
- 5.3.2.3 Rest of South America
- 5.3.3 Europe
- 5.3.3.1 Germany
- 5.3.3.2 United Kingdom
- 5.3.3.3 France
- 5.3.3.4 Italy
- 5.3.3.5 Spain
- 5.3.3.6 Russia
- 5.3.3.7 Rest of Europe
- 5.3.4 Asia-Pacific
- 5.3.4.1 China
- 5.3.4.2 Japan
- 5.3.4.3 India
- 5.3.4.4 South Korea
- 5.3.4.5 South-East Asia
- 5.3.4.6 Rest of Asia-Pacific
- 5.3.5 Middle East and Africa
- 5.3.5.1 Middle East
- 5.3.5.1.1 Saudi Arabia
- 5.3.5.1.2 United Arab Emirates
- 5.3.5.1.3 Turkey
- 5.3.5.1.4 Rest of Middle East
- 5.3.5.2 Africa
- 5.3.5.2.1 South Africa
- 5.3.5.2.2 Nigeria
- 5.3.5.2.3 Rest of Africa
- 5.3.5.1 Middle East
- 5.3.1 North America
6 COMPETITIVE LANDSCAPE
- 6.1 Market Concentration
- 6.2 Strategic Moves
- 6.3 Market Share Analysis
- 6.4 Company Profiles (includes Global level Overview, Market level overview, Core Segments, Financials as available, Strategic Information, Market Rank/Share for key companies, Products and Services, and Recent Developments)
- 6.4.1 SGS SA
- 6.4.2 Bureau Veritas SA
- 6.4.3 Intertek Group plc
- 6.4.4 DEKRA SE
- 6.4.5 TUV SUD AG
- 6.4.6 TUV Rheinland Group
- 6.4.7 Applus Services SA
- 6.4.8 DNV AS
- 6.4.9 Lloyd's Register Group Ltd
- 6.4.10 Element Materials Technology Group
- 6.4.11 ALS Limited
- 6.4.12 Eurofins Scientific SE
- 6.4.13 UL LLC
- 6.4.14 MISTRAS Group Inc.
- 6.4.15 Kiwa N.V.
- 6.4.16 CSA Group
- 6.4.17 Control Union Certifications B.V.
- 6.4.18 RINA S.p.A.
- 6.4.19 NSF International
- 6.4.20 BSI Group
- 6.4.21 TUV NORD AG
- 6.4.22 PONY Testing International Group
- 6.4.23 ABS Group of Companies Inc.
- 6.4.24 Vicom Ltd
- 6.4.25 CCIC (China Certification and Inspection Group)
7 MARKET OPPORTUNITIES AND FUTURE OUTLOOK
- 7.1 White-space and Unmet-Need Assessment

