PUBLISHER: Mordor Intelligence | PRODUCT CODE: 2097329

PUBLISHER: Mordor Intelligence | PRODUCT CODE: 2097329
Energy Engineering Services Outsourcing (ESO) - Market Share Analysis, Industry Trends & Statistics, Growth Forecasts (2026 - 2031)
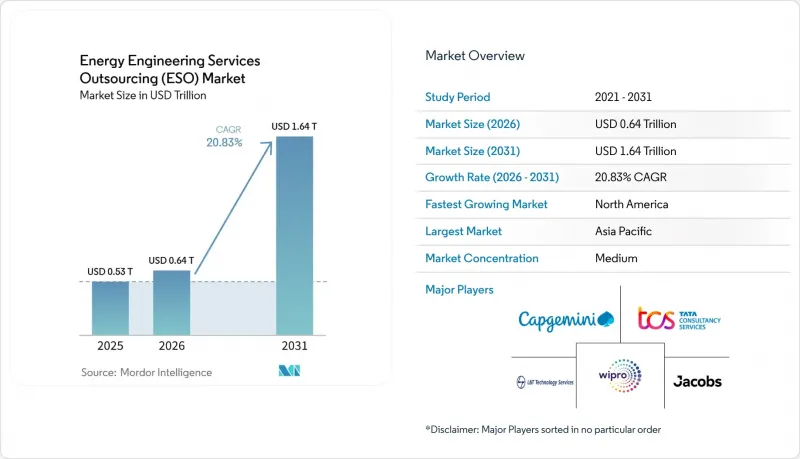
According to Mordor Intelligence, the energy engineering services outsourcing market size is expected to grow from USD 0.53 trillion in 2025 to USD 0.64 trillion in 2026 and is forecast to reach USD 1.64 trillion by 2031 at 20.83% CAGR over 2026-2031.
This report is Segmented by Service Type (Structuring and Layout, Digitization, and More), Deployment Model (Onshore and Offshore), Sourcing Model (Captive Outsourcing and Third-Party Outsourcing), Energy Source (Renewable, and More), and Geography (North America, Europe, Asia-Pacific, South America, Middle East and Africa). Market Forecasts are Provided in Value (USD).
Global Energy Engineering Services Outsourcing (ESO) Market Trends and Insights
Decarbonization Mandates Drive Renewable Integration Complexity
Binding climate legislation, such as the European Union Fit for 55 package and the United States Inflation Reduction Act, requires utilities to integrate large volumes of intermittent renewables within compressed timelines. As grid operators lack in-house skills in power-electronics modeling, harmonics management, and hybrid storage design, they increasingly contract specialist engineering partners to co-design inverter specifications, dynamic line-rating strategies, and advanced energy-management algorithms. The complexity is magnified by the need to retrofit aging substations while maintaining reliability indices. Outsourcing providers now bundle grid-code compliance, protection studies, and commissioning services, creating a one-stop solution that accelerates project approval and reduces schedule risk. Demand is strongest in mature markets where 2030 net-zero targets trigger multibillion-dollar transmission reinforcements and flexible-resource additions.
Cost Pressures Accelerate Operational Efficiency Through Outsourcing
Labor arbitrage remains a key driver of the energy engineering services outsourcing market. In 2025, India hosted 77 energy-focused global capability centers employing approximately 50,000 professionals. Chevron's USD 1 billion Bengaluru hub alone plans to add 600 engineers focused on front-end design for upstream assets. Comparable roles in Houston can cost three times Indian salaries, allowing operators to redeploy domestic staff toward strategic planning while offshore teams working across time zones handle piping isometrics, loop diagrams, and quantity take-offs. Shell's India workforce exceeded 13,000 in 2025, providing LNG terminal engineering and digital support services that reduce cycle times and support margins. Attrition remains a challenge; however, remote tools, standardized design libraries, and automated quality checks help keep unit costs down even as salary inflation rises.
Cyber-security Concerns Limit Critical Infrastructure Outsourcing
The 2024 revision of NIST SP 800-82 elevated security baselines for industrial control systems and tightened third-party access provisions. Utilities now conduct more stringent vendor risk assessments covering supply chain pedigree, zero-trust architectures, and software bill-of-materials disclosure. Intellectual property leakage concerns are significant in advanced control algorithms that underpin renewable curtailment minimization and voltage-ride-through compliance. Some critical national infrastructure owners require onshore engineering centers even at 25-30% cost premiums, which delays award timelines and limits provider pools. Compliance with NERC CIP, ISO 27001, and regional privacy statutes increases transaction costs and slows cross-border file exchange, particularly for multi-cloud model hosting.
Other drivers and restraints analyzed in the detailed report include:
- Digital Transformation Enables Advanced Engineering Service Models
- LNG Infrastructure Expansion Creates Specialized Engineering Demand
- Oil Price Volatility Constrains Energy CAPEX Investment
For complete list of drivers and restraints, kindly check the Table Of Contents.
Segment Analysis
Digitization bookings are forecast to expand at a 25.6% CAGR between 2026 and 2031, outpacing the overall energy engineering services outsourcing market. In 2025, Structuring and Layout dominated with a 33.3% revenue share, as LNG trains, offshore platforms, and utility-scale solar farms required intensive three-dimensional modeling and plot-plan optimization. Digitization now incorporates cloud collaboration, generative design, and predictive analytics into these traditional scopes, reducing change-order cycles and lowering installed costs. For instance, Siemens digital twins prevented 15% of potential clashes before fabrication, while Tata Consultancy Services integrated smart-meter datasets into AI models that helped defer hundreds of millions of USD in distribution upgrades. The energy engineering services outsourcing market size tied to digitization is therefore on a trajectory to match traditional drafting revenue by 2029. Market share metrics will continue to shift toward software-heavy scopes as owners demand faster iterations and lower rework.
R&D and designing services benefit when project developers require feasibility studies and novel material selection. However, they rely on scarce senior talent, so growth remains just below that of digitization. Implementation and maintenance activities scale with the installed asset base, contributing steady fee streams but at a slower growth rate. Environmental and decommissioning services round out the portfolio and are rising in line with stricter emissions regulations. Across these workstreams, energy engineering services outsourcing market dynamics favor vendors that combine domain engineers with data scientists, shortening the path from conceptual model to execution.
Offshore scopes are projected to grow at a 22.7% CAGR through 2031, outpacing the onshore segment, which accounted for 61.1% of 2025 spending. Floating wind systems in waters deeper than 200 m, subsea HVDC converters, and deepwater oil tie-backs each require hydrodynamic modeling, mooring analysis, and corrosion studies that support rate premiums. Equinor's Hywind Tampen recorded capacity factors above 50%, but only after extensive station-keeping simulations and dynamic-cable fatigue testing. The energy engineering services outsourcing market size for offshore scopes could surpass USD 600 billion by 2031 if announced lease rounds in California, Japan, and South Korea proceed as planned. Onshore solar EPC, gas-fired combined-cycle projects, and substations remain attractive in emerging markets where build-out volumes are high, though margins face pressure from software automation. Energy engineering services outsourcing market participants therefore balance their portfolios: offshore contracts deliver higher profitability but longer bid cycles, while onshore work maintains utilization rates.
Complete Report Scope:
- By Service Type
- Structuring & Layout
- Digitization
- R&D & Designing
- Implementation & Maintenance
- Other Services
- By Deployment Model
- Onshore
- Offshore
- By Sourcing Model (Qualitative Analysis Only)
- Captive Outsourcing
- Third-party Outsourcing
- By Energy Source
- Renewable
- Non-renewable
- Chemical Processing
- By Geography
- North America
- United States
- Canada
- Mexico
- Europe
- Germany
- United Kingdom
- France
- Italy
- NORDIC Countries
- Russia
- Rest of Europe
- Asia-Pacific
- China
- India
- Japan
- South Korea
- ASEAN Countries
- Rest of Asia-Pacific
- South America
- Brazil
- Argentina
- Rest of South America
- Middle East and Africa
- Saudi Arabia
- United Arab Emirates
- South Africa
- Egypt
- Rest of Middle East and Africa
- North America
Geography Analysis
Asia-Pacific accounted for 43.4% of 2025 revenue, supported by India's large engineering talent pool, China's offshore wind expansion, and Southeast Asia's LNG import plans. The energy engineering services outsourcing market continues to benefit from wage differences, with average Indian engineering salaries at approximately 35% of U.S. equivalents. China's offshore capacity increased sharply in 2025 and targets at least 120 GW by 2030, sustaining demand for blade design and subsea cable routing. Data sovereignty laws may limit some cross-border collaboration, though near-shore service centers in Malaysia and the Philippines are emerging as alternatives for Western clients.
North America is projected to grow at a 24.9% CAGR through 2031, driven by renewables tax credits, LNG export terminals, and hydrogen hubs supported by U.S. federal grants. Projects such as Calcasieu Pass 2, Golden Pass LNG, and the Alaska LNG venture collectively exceed USD 70 billion in capital expenditure and support multi-year engineering workstreams. Offshore wind prospects in the New York Bight and California are substantial, though lease moratoriums and procurement cost inflation present risks.
Europe's offshore wind market remains a key segment despite permitting timelines of five to seven years. Cable awards to NKT and Prysmian confirm continued spending, while hydrogen-ready pipeline conversions in Germany and Denmark expand downstream scopes. Data protection regulations require in-region data centers, prompting vendors to establish EU-based secure engineering infrastructure.
The Middle East is directing capital into gigawatt-scale green hydrogen, solar-plus-storage, and new LNG hubs. Saudi Arabia's NEOM Green Hydrogen project, with 4 GW of renewable generation and 600 t/d hydrogen output, is among the largest ongoing outsourced engineering programs globally.
South America and Africa contribute smaller but strategic workloads. Petrobras' pre-salt subsea systems and South Africa's renewables auctions each drive niche demand, though currency volatility and local-content mandates narrow margins for international vendors.
- AECOM
- AFRY AB
- Alten S.A.
- Altran Technologies S.A.
- AtkinsRealis Group Inc.
- Black & Veatch Holding Company
- Capgemini SE
- Cyient Limited
- HCL Technologies Limited
- Hitachi Energy Ltd.
- Infosys Limited
- Jacobs Solutions Inc.
- Larsen & Toubro Technology Services Limited (LTTS)
- Ramboll Group A/S
- SNC-Lavalin Group Inc.
- Tata Consultancy Services Limited (TCS)
- Tech Mahindra Limited
- Wipro Limited
- Wood plc
- Worley Limited
Additional Benefits:
- The market estimate (ME) sheet in Excel format
- 3 months of analyst support
TABLE OF CONTENTS
1 Introduction
- 1.1 Study Assumptions & Market Definition
- 1.2 Scope of the Study
2 Research Methodology
3 Executive Summary
4 Market Landscape
- 4.1 Market Overview
- 4.2 Market Drivers
- 4.2.1 Decarbonization mandates & renewable integration
- 4.2.2 Cost pressure & need for operational efficiency
- 4.2.3 Digitalization & Industry 4.0 adoption
- 4.2.4 Expansion of LNG & gas infrastructure
- 4.2.5 Subsea power-cable engineering for offshore wind clusters
- 4.2.6 Hydrogen-ready pipeline retrofit demand
- 4.3 Market Restraints
- 4.3.1 Cyber-security & IP concerns in outsourcing
- 4.3.2 Oil-price volatility dampening CAPEX
- 4.3.3 Shortage of niche renewable domain experts
- 4.3.4 Geopolitical data-transfer restrictions
- 4.4 Supply-Chain Analysis
- 4.5 Regulatory Landscape
- 4.6 Technological Outlook
- 4.7 Porters Five Forces Analysis
- 4.7.1 Threat of New Entrants
- 4.7.2 Bargaining Power of Buyers
- 4.7.3 Bargaining Power of Suppliers
- 4.7.4 Threat of Substitutes
- 4.7.5 Competitive Rivalry
5 Market Size & Growth Forecasts
- 5.1 By Service Type
- 5.1.1 Structuring & Layout
- 5.1.2 Digitization
- 5.1.3 R&D & Designing
- 5.1.4 Implementation & Maintenance
- 5.1.5 Other Services
- 5.2 By Deployment Model
- 5.2.1 Onshore
- 5.2.2 Offshore
- 5.3 By Sourcing Model (Qualitative Analysis Only)
- 5.3.1 Captive Outsourcing
- 5.3.2 Third-party Outsourcing
- 5.4 By Energy Source
- 5.4.1 Renewable
- 5.4.2 Non-renewable
- 5.4.3 Chemical Processing
- 5.5 By Geography
- 5.5.1 North America
- 5.5.1.1 United States
- 5.5.1.2 Canada
- 5.5.1.3 Mexico
- 5.5.2 Europe
- 5.5.2.1 Germany
- 5.5.2.2 United Kingdom
- 5.5.2.3 France
- 5.5.2.4 Italy
- 5.5.2.5 NORDIC Countries
- 5.5.2.6 Russia
- 5.5.2.7 Rest of Europe
- 5.5.3 Asia-Pacific
- 5.5.3.1 China
- 5.5.3.2 India
- 5.5.3.3 Japan
- 5.5.3.4 South Korea
- 5.5.3.5 ASEAN Countries
- 5.5.3.6 Rest of Asia-Pacific
- 5.5.4 South America
- 5.5.4.1 Brazil
- 5.5.4.2 Argentina
- 5.5.4.3 Rest of South America
- 5.5.5 Middle East and Africa
- 5.5.5.1 Saudi Arabia
- 5.5.5.2 United Arab Emirates
- 5.5.5.3 South Africa
- 5.5.5.4 Egypt
- 5.5.5.5 Rest of Middle East and Africa
- 5.5.1 North America
6 Competitive Landscape
- 6.1 Market Concentration
- 6.2 Strategic Moves (M&A, Partnerships, PPAs)
- 6.3 Market Share Analysis (Market Rank/Share for key companies)
- 6.4 Company Profiles (includes Global level Overview, Market level overview, Core Segments, Financials as available, Strategic Information, Products & Services, and Recent Developments)
- 6.4.1 AECOM
- 6.4.2 AFRY AB
- 6.4.3 Alten S.A.
- 6.4.4 Altran Technologies S.A.
- 6.4.5 AtkinsRealis Group Inc.
- 6.4.6 Black & Veatch Holding Company
- 6.4.7 Capgemini SE
- 6.4.8 Cyient Limited
- 6.4.9 HCL Technologies Limited
- 6.4.10 Hitachi Energy Ltd.
- 6.4.11 Infosys Limited
- 6.4.12 Jacobs Solutions Inc.
- 6.4.13 Larsen & Toubro Technology Services Limited (LTTS)
- 6.4.14 Ramboll Group A/S
- 6.4.15 SNC-Lavalin Group Inc.
- 6.4.16 Tata Consultancy Services Limited (TCS)
- 6.4.17 Tech Mahindra Limited
- 6.4.18 Wipro Limited
- 6.4.19 Wood plc
- 6.4.20 Worley Limited
7 Market Opportunities & Future Outlook
- 7.1 White-Space & Unmet-Need Assessment

