PUBLISHER: Mordor Intelligence | PRODUCT CODE: 2097503

PUBLISHER: Mordor Intelligence | PRODUCT CODE: 2097503
US Non Fuel Grade Alcohol - Market Share Analysis, Industry Trends & Statistics, Growth Forecasts (2026 - 2031)
According to Mordor Intelligence, the US non-fuel grade alcohol market was valued at USD 5.57 billion in 2025 and reached USD 5.87 billion in 2026, with projections indicating growth to USD 7.68 billion by 2031 at a CAGR of 5.55% during 2026-2031.
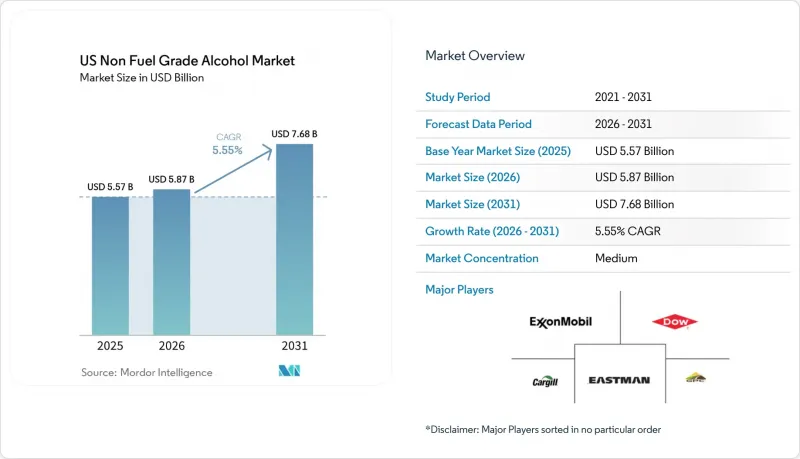
This report is Segmented by Type (Ethanol, Isopropyl Alcohol, Methanol, Butanol, Benzyl Alcohol, and Others), Grade (Food Grade, Pharmaceutical Grade, and Industrial Grade/Chemical Grade), Source (Corn, Sugar and Molasses, Grains (Wheat, Barley, Rye), Fruits, and Others), and Application (Food and Beverages, Pharmaceuticals, and More). The Market Forecasts are Provided in Terms of Value (USD).
US Non Fuel Grade Alcohol Market Trends and Insights
Premiumization of craft and specialty alcohol products
The premiumization of craft and specialty alcohol products has become a significant growth driver in the U.S. non-fuel alcohol market. Manufacturers are increasingly incorporating high-purity alcohols into premium beverages, artisanal flavor extracts, specialty ingredients, and high-end food applications. Consumers are prioritizing products that deliver superior quality, authenticity, and enhanced sensory experiences, prompting brands to focus on premium formulations and higher-grade alcohol ingredients. This trend has boosted the demand for food-grade and specialty alcohols, enabling product differentiation and premium positioning within the food and beverage industry. This growth driver is further reinforced by shifting consumer spending preferences. In 2024, 67% of global consumers reported a willingness to pay more for higher-quality products, while 63% expressed readiness to pay a premium for convenience .
Expansion of personal care and cosmetics formulations
The growth of personal care and cosmetics formulations is a key factor driving the U.S. non-fuel alcohol market. Alcohols such as ethanol and isopropyl alcohol are extensively used in products like perfumes, deodorants, skincare items, hair care formulations, and cosmetic sprays. These alcohols function as solvents, preservatives, and carriers, contributing to product stability, texture, and performance. This trend is bolstered by increasing consumer spending on beauty and personal care products. In 2025, consumer expenditure on cosmetics and personal care products reached approximately EUR 38.3 billion, highlighting robust global demand for beauty and grooming solutions . As brands continue to develop new formulations emphasizing efficacy, convenience, and premium experiences, the demand for non-fuel alcohols as critical formulation components is anticipated to remain strong, driving market growth within the personal care and cosmetics industry.
Feedstock price volatility in corn, grains, and sugar inputs
Feedstock price volatility in corn, grains, and sugar inputs serves as a significant restraint on the U.S. non-fuel alcohol market. The production of ethanol and other fermentation-based alcohols is highly dependent on agricultural raw materials. Prices of these inputs are influenced by factors such as weather conditions, crop yields, input costs, trade policies, and supply-demand imbalances. These fluctuations can substantially impact production costs and profit margins for manufacturers, introducing uncertainty throughout the value chain. Increasing feedstock costs can undermine the cost competitiveness of non-fuel alcohols, especially in price-sensitive applications like food processing, industrial solvents, and personal care products. Furthermore, unpredictable raw material pricing complicates procurement planning and long-term supply agreements, restricting manufacturers' ability to sustain stable pricing and operational efficiency. Consequently, feedstock price volatility continues to pose a persistent challenge for market participants dependent on agricultural inputs.
Other drivers and restraints analyzed in the detailed report include:
- Increasing adoption in food and beverage processing applications
- Increasing demand for bio-based solvents and green chemistry
- Complex regulatory and quality compliance requirements
For complete list of drivers and restraints, kindly check the Table Of Contents.
Segment Analysis
In 2025, ethanol held the largest share of the U.S. non-fuel alcohol market at 57.56%, driven by its widespread use in pharmaceuticals, food and beverage processing, personal care products, and industrial solvent applications. Its leading position is attributed to robust bio-based production capacity, broad regulatory acceptance, and its versatile functionality as a solvent, preservative, and chemical feedstock. The scalability of ethanol production and its integration into both consumer and industrial value chains have solidified its status as the dominant non-fuel alcohol in the U.S. market.
Conversely, isopropyl alcohol represented a 6.94% share of the market in 2025, primarily due to its essential role in disinfectants, sanitizers, pharmaceuticals, electronics cleaning, and industrial applications. Its rapid evaporation rate and strong antimicrobial properties make it particularly suitable for hygiene and precision cleaning purposes. Although its market size is smaller compared to ethanol due to its more specialized applications, demand remains supported by increasing hygiene standards, healthcare consumption, and industrial cleaning needs across various end-use sectors.
In 2025, the food-grade segment held the largest share of the U.S. non-fuel alcohol market at 36.81%, primarily due to its extensive application in food processing, beverage production, flavor extraction, and as a processing aid in packaged food products. This dominance is attributed to strong demand from the food and beverage industry, where ethanol is commonly used for formulation, preservation, and extraction purposes. The segment also benefits from established regulatory approvals and consistent demand across large-scale food manufacturing operations.
In comparison, the pharmaceutical-grade segment accounted for a 7.13% share in 2025, driven by its essential role in drug formulation, antiseptics, sanitizers, and other medical applications requiring high purity standards. Growth in this segment is supported by increasing healthcare consumption, heightened hygiene awareness, and the expansion of pharmaceutical manufacturing activities. However, its market share remains smaller than that of food grade due to its narrower range of applications and stricter compliance requirements, which limit scalability across broader industrial uses.
Complete Report Scope:
- By Type
- Ethanol
- Isopropyl Alcohol
- Methanol
- Butanol
- Benzyl Alcohol
- Others
- By Grade
- Food Grade
- Pharmaceutical Grade
- Industrial Grade/Chemical Grade
- By Source
- Corn
- Sugar and Molasses
- Grains (Wheat, Barley, Rye)
- Fruits
- Others
- By Application
- Food and Beverages
- Pharmaceuticals
- Cosmetics and Personal Care
- Chemical Solvent
- Others
List of Companies Covered in this Report:
- Archer Daniels Midland Company
- Cargill, Incorporated
- Dow Inc.
- Eastman Chemical Company
- Exxon Mobil Corporation
- Flint Hills Resources
- Grain Processing Corporation
- Green Plains Inc.
- Greenfield Global Inc.
- INEOS Group Holdings S.A.
- LyondellBasell Industries N.V.
- MGP Ingredients, Inc.
- Merck KGaA
- Pacific Ethanol, Inc.
- SABIC
- Sigma-Aldrich Corporation
- Univar Solutions Inc.
- Valero Energy Corporation
- Wilmar International Limited
- The Andersons, Inc.
Additional Benefits:
- The market estimate (ME) sheet in Excel format
- 3 months of analyst support
TABLE OF CONTENTS
1 INTRODUCTION
- 1.1 Study Assumptions and Market Definition
- 1.2 Scope of the Study
2 RESEARCH METHODOLOGY
3 EXECUTIVE SUMMARY
4 MARKET LANDSCAPE
- 4.1 Market Overview
- 4.2 Market Drivers
- 4.2.1 Premiumization of craft and specialty alcohol products
- 4.2.2 Expansion of personal care and cosmetics formulations
- 4.2.3 Increasing adoption in food and beverage processing applications
- 4.2.4 Rising pharmaceutical and nutraceutical manufacturing activity
- 4.2.5 Increasing demand for bio-based solvents and green chemistry
- 4.2.6 Tightening preference for renewable feedstocks and lower-carbon processing
- 4.3 Market Restraints
- 4.3.1 Feedstock price volatility in corn, grains, and sugar inputs
- 4.3.2 Complex regulatory and quality compliance requirements
- 4.3.3 Competition from alternative solvents and synthetic ingredients
- 4.3.4 High capital and operating costs associated with high-purity alcohol production
- 4.4 Supply Chain Analysis
- 4.5 Regulatory Landscape
- 4.6 Technological Outlook
- 4.7 Porter's Five Forces
- 4.7.1 Threat of New Entrants
- 4.7.2 Bargaining Power of Buyers
- 4.7.3 Bargaining Power of Suppliers
- 4.7.4 Threat of Substitutes
- 4.7.5 Competitive Rivalry
5 MARKET SIZE AND GROWTH FORECASTS (VALUE)
- 5.1 By Type
- 5.1.1 Ethanol
- 5.1.2 Isopropyl Alcohol
- 5.1.3 Methanol
- 5.1.4 Butanol
- 5.1.5 Benzyl Alcohol
- 5.1.6 Others
- 5.2 By Grade
- 5.2.1 Food Grade
- 5.2.2 Pharmaceutical Grade
- 5.2.3 Industrial Grade/Chemical Grade
- 5.3 By Source
- 5.3.1 Corn
- 5.3.2 Sugar and Molasses
- 5.3.3 Grains (Wheat, Barley, Rye)
- 5.3.4 Fruits
- 5.3.5 Others
- 5.4 By Application
- 5.4.1 Food and Beverages
- 5.4.2 Pharmaceuticals
- 5.4.3 Cosmetics and Personal Care
- 5.4.4 Chemical Solvent
- 5.4.5 Others
6 COMPETITIVE LANDSCAPE
- 6.1 Market Concentration
- 6.2 Strategic Moves
- 6.3 Market Share Analysis
- 6.4 Company Profiles (includes Global level Overview, Market level overview, Core Segments, Financials as available, Strategic Information, Market Rank/Share for key companies, Products and Services, and Recent Developments)
- 6.4.1 Archer Daniels Midland Company
- 6.4.2 Cargill, Incorporated
- 6.4.3 Dow Inc.
- 6.4.4 Eastman Chemical Company
- 6.4.5 Exxon Mobil Corporation
- 6.4.6 Flint Hills Resources
- 6.4.7 Grain Processing Corporation
- 6.4.8 Green Plains Inc.
- 6.4.9 Greenfield Global Inc.
- 6.4.10 INEOS Group Holdings S.A.
- 6.4.11 LyondellBasell Industries N.V.
- 6.4.12 MGP Ingredients, Inc.
- 6.4.13 Merck KGaA
- 6.4.14 Pacific Ethanol, Inc.
- 6.4.15 SABIC
- 6.4.16 Sigma-Aldrich Corporation
- 6.4.17 Univar Solutions Inc.
- 6.4.18 Valero Energy Corporation
- 6.4.19 Wilmar International Limited
- 6.4.20 The Andersons, Inc.
7 MARKET OPPORTUNITIES AND FUTURE OUTLOOK

