PUBLISHER: Mordor Intelligence | PRODUCT CODE: 2100563

PUBLISHER: Mordor Intelligence | PRODUCT CODE: 2100563
Carbon Fiber - Market Share Analysis, Industry Trends & Statistics, Growth Forecasts (2026 - 2031)
According to Mordor Intelligence, the carbon fiber market size is expected to grow from 207.83 kilotons in 2025 to 245.37 kilotons in 2026 and is forecast to reach 562.77 kilotons by 2031 at 18.06% CAGR over 2026-2031.
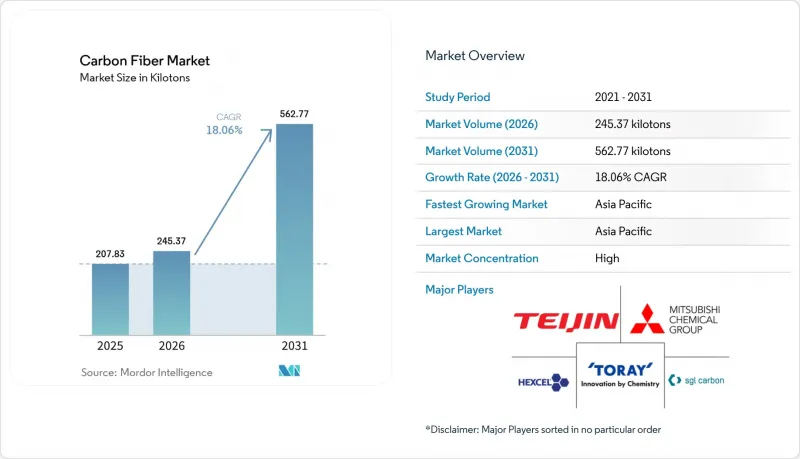
This report is Segmented by Raw Material (Polyacrylonitrile, and Petroleum Pitch and Rayon), Fiber Type (Virgin Carbon Fiber, Recycled Carbon Fiber, and Others), Application (Composite Materials, Textiles, and More), End-User Industry (Aerospace and Defense, Alternative Energy, and More), and Geography (Asia-Pacific, North America, and More). The Market Forecasts are Provided in Terms of Volume (tons).
Global Carbon Fiber Market Trends and Insights
Rising Production of Hydrogen and CNG Pressure Vessels for Commercial Mobility
Type IV cylinders that wrap polymer liners with carbon fiber now define the 700-bar storage standard for fuel-cell trucks, buses, and trains, contributing to carbon fiber market share growth. Voith's Carbon4Tank cleared UNECE Regulation 134 burst-pressure tests above 1,050 bar, opening series supply to European heavy-duty fleets. The U.S. Department of Energy calculated a cost of USD 12.7 per kilowatt-hour in 2024, down from USD 18 in 2020, as filament-winding automation and precursor price stability improved economics. Luxfer and Hexagon Purus enlarged North American and European manufacturing footprints, each tank incorporating 25-30 kg of fiber and delivering 8-12% higher payload versus steel cylinders. ISO 11119 and DOT FMVSS 304 fatigue requirements over 15,000 cycles reinforce the reliability edge against aluminum-lined alternatives. Fleet operators see lower lifetime cost from lighter tanks, which accelerates commercial adoption in long-haul corridors.
Rapid Deployment of Offshore Wind Turbines Requiring High-Strength Blades
Next-generation turbines in the 11-22 MW class employ 100-143 m blades that need spar-cap tensile strength exceeding 4,800 MPa. Siemens Gamesa's B108 integrates carbon-fiber spars to shave 20% blade mass, lowering tower-top loads and installation cost. Mingyang Smart Energy's 143 m blade for an 18 MW platform consumes 15-18 tons of fiber, translating to roughly 50,000 tons of annual demand for offshore blades alone. Europe added 4.2 GW of offshore capacity in 2024, and blade carbon-fiber content climbed to 25-30% of mass, up from 15% in 2020. Taiwan and Japan deploy floating platforms in typhoon-prone waters, where carbon composites withstand cyclic fatigue 30-40% better than glass fiber. These factors secure a multiyear pull for structural composites across Asian and European coastlines.
Energy-Intensive Oxidation and Carbonization
Producing one kilogram of fiber consumes 50-100 kWh and emits 20-30 kg of CO2, up to five times more than aluminum extrusion, posing a major challenge for the carbon fiber industry. European electricity costs of EUR 0.15-0.25 per kWh in 2024-2025 raised manufacturing costs by USD 5-8 per kg, widening the gap with Asian suppliers powered by low-cost coal. Toray targets a 30% absolute emissions cut by 2030 via renewable electricity and waste-heat recovery at its Hungary site, yet carbonization furnaces still lock in high intensity. Mitsubishi Chemical pilots lower-temperature PAN that trims energy 15-20%, but commercial rollout is two to three years away. Customers now request Environmental Product Declarations under ISO 14025, so fiber makers must invest an estimated USD 500 million to reach the 2030 target of below 15 kg CO2 per kg of fiber.
Other drivers and restraints analyzed in the detailed report include:
- Adoption of Battery-Pack Enclosures and Lightweighting in EV Platforms
- 3D Automated Fiber-Placement Lines Slashing Composite Cycle Times
- Supply-Chain Risks for Recycled Carbon Fiber Feedstock
For complete list of drivers and restraints, kindly check the Table Of Contents.
Segment Analysis
Polyacrylonitrile captured 95.18% of the 2025 volume and is anticipated to grow with a CAGR of 18.91% during the forecast period. Its strong carbon yield keeps average cost near USD 12-14 per kg even after energy surcharges, helping the carbon fiber market defend against thermoplastic substitution. Tight supply in 2024-2025 lifted spot PAN to USD 8-10 per kg, forcing some converters to invoke force-majeure clauses on automotive contracts. China's Jilin Chemical and Bluestar control up to 70% of global precursor capacity, giving Asia-Pacific leverage over global pricing.
Pilot programs for microwave-assisted oxidation show 25-30% faster cycle time and 15-20% lower energy use, pointing to a structural cost decline after 2028. Pitch and rayon remain niche but vital for ultra-high-modulus spacecraft structures and thermal barriers that demand modulus above 800 GPa. Hyosung's 4,000-ton expansion and bio-based acrylonitrile initiatives promise a 30-40% lifecycle-emission cut, aligning with OEM net-zero targets. The carbon fiber market size for PAN-based grades is projected to move in lockstep with acrylonitrile availability; any prolonged outage in Shandong or Jiangsu could ripple through the value chain within nine months.
Virgin grades kept 62.95% share in 2025, accounting for the largest carbon fiber market share mainly serving aerospace and defense programs that require lot-traceability and tight mechanical tolerances. Recycled volumes are anticipated to grow with a CAGR of 19.87% through 2031 on the back of automotive and wind energy pull, yet certification for primary structures remains outside the 2026 planning horizon.
ELG Carbon Fibre recovers 90-95% of virgin strength from aerospace scrap, enabling seat frames and overhead bins at 30-50% lower cost. Karborek's solvolysis route retains fibers above 80 mm but must manage solvent waste streams that raise operating costs. Gen 2 Carbon closes the loop on thermoplastic parts, a key differentiator as EV battery-tray volumes rise. The carbon fiber market share for recycled grades is poised to widen further once wind-blade decommissioning accelerates after 2027, providing a stable feedstock base.
Complete Report Scope:
- By Raw Material
- Polyacrylonitrile (PAN)
- Petroleum Pitch and Rayon
- By Fiber Type
- Virgin Carbon Fiber (VCF)
- Recycled Carbon Fiber (RCF)
- Others
- By Application
- Composite Materials
- Textiles
- Micro-Electrodes
- Catalysis
- By End-User Industry
- Aerospace and Defense
- Alternative Energy
- Automotive
- Construction and Infrastructure
- Sporting Goods
- Other End-user Industries
- By Geography
- Asia-Pacific
- China
- Japan
- India
- South Korea
- Rest of Asia-Pacific
- North America
- United States
- Canada
- Mexico
- Europe
- Germany
- United Kingdom
- France
- Italy
- Rest of Europe
- South America
- Brazil
- Argentina
- Rest of South America
- Middle-East and Africa
- Saudi Arabia
- United Arab Emirates
- South Africa
- Egypt
- Rest of Middle-East and Africa
- Asia-Pacific
Geography Analysis
Asia-Pacific led the carbon fiber market with 44.89% share in 2025 and is set to grow at a 20.75% CAGR through 2031. China's vertically integrated precursor-to-fiber chains, Japan's aerospace-grade specialties, and India's offset policies guarantee strong local pull. Taiwan's 4.5 GW offshore wind fleet and South Korea's automotive suppliers add further upside. Low electricity prices and captive acrylonitrile supply cement the region's cost advantage.
North America ranks second by volume, with the United States carbon fiber market boosted by Boeing, Lockheed Martin, and battery-electric vehicle initiatives tied to the Inflation Reduction Act incentives. Toray's 5,000 ton South Carolina line will cover automotive grades, while Hexcel's Salt Lake City expansion supports 787 and A350 wing spars. Recycled-fiber networks in Washington and Maine supply Tier 1 automotive interiors, expanding domestic circularity, strengthening the regional carbon fiber industry.
Europe combines offshore wind, strict vehicle emissions rules, and Airbus aerostructures to maintain high utilization despite energy-price volatility. Siemens Gamesa blades integrate carbon-fiber spar caps that reduce mass by 20%. Germany's automakers rely on thermoplastic composites from SGL Carbon's Meitingen plant to meet the 95 g/km CO2 target. The EU Critical Raw Materials Act encourages domestic capacity, and Toray's Hungary site now sources renewable electricity to cut lifecycle emissions 30%, supporting the regional carbon fiber industry.
- AandP Technology, Inc.
- Anshan Senoda Carbon Fiber Co., Ltd.
- DowAksa
- Formosa Plastics Group
- Hexcel Corporation
- HS HYOSUNG ADVANCED MATERIALS
- Jiangsu Hengshen Co.,Ltd
- KUREHA CORPORATION
- Mitsubishi Chemical Group Corporation
- Nippon Graphite Fiber Co., Ltd.
- Rock West Composites, Inc.
- SGL Carbon
- Sigmatex (UK) Limited
- Solvay
- Taekwang Industrial Co., Ltd.
- Teijin Limited
- TORAY INDUSTRIES, INC.
- UMATEX
- Zhongfu Shenying Carbon Fiber Co., Ltd.
Additional Benefits:
- The market estimate (ME) sheet in Excel format
- 3 months of analyst support
TABLE OF CONTENTS
1 Introduction
- 1.1 Study Assumptions and Market Definition
- 1.2 Scope of the Study
2 Research Methodology
3 Executive Summary
4 Market Landscape
- 4.1 Market Overview
- 4.2 Market Drivers
- 4.2.1 Rising production of hydrogen and CNG pressure vessels for commercial mobility
- 4.2.2 Rapid deployment offshore wind turbines requiring high-strength blades
- 4.2.3 Adoption of battery-pack enclosures and lightweighting in EV platforms
- 4.2.4 3-D automated fiber-placement lines slashing composite cycle times
- 4.2.5 Local-content mandates in India and MENA aerospace offset programs
- 4.3 Market Restraints
- 4.3.1 Energy-intensive oxidation and carbonization
- 4.3.2 Supply-chain risks for recycled carbon fiber feedstock
- 4.3.3 Competition from high-performance thermoplastics in sporting goods
- 4.4 Value Chain Analysis
- 4.5 Technological Outlook
- 4.6 Porter's Five Forces
- 4.6.1 Bargaining Power of Suppliers
- 4.6.2 Bargaining Power of Buyers
- 4.6.3 Threat of New Entrants
- 4.6.4 Threat of Substitutes
- 4.6.5 Degree of Competition
5 Market Size and Growth Forecasts (Value and Volume)
- 5.1 By Raw Material
- 5.1.1 Polyacrylonitrile (PAN)
- 5.1.2 Petroleum Pitch and Rayon
- 5.2 By Fiber Type
- 5.2.1 Virgin Carbon Fiber (VCF)
- 5.2.2 Recycled Carbon Fiber (RCF)
- 5.2.3 Others
- 5.3 By Application
- 5.3.1 Composite Materials
- 5.3.2 Textiles
- 5.3.3 Micro-Electrodes
- 5.3.4 Catalysis
- 5.4 By End-User Industry
- 5.4.1 Aerospace and Defense
- 5.4.2 Alternative Energy
- 5.4.3 Automotive
- 5.4.4 Construction and Infrastructure
- 5.4.5 Sporting Goods
- 5.4.6 Other End-user Industries
- 5.5 By Geography
- 5.5.1 Asia-Pacific
- 5.5.1.1 China
- 5.5.1.2 Japan
- 5.5.1.3 India
- 5.5.1.4 South Korea
- 5.5.1.5 Rest of Asia-Pacific
- 5.5.2 North America
- 5.5.2.1 United States
- 5.5.2.2 Canada
- 5.5.2.3 Mexico
- 5.5.3 Europe
- 5.5.3.1 Germany
- 5.5.3.2 United Kingdom
- 5.5.3.3 France
- 5.5.3.4 Italy
- 5.5.3.5 Rest of Europe
- 5.5.4 South America
- 5.5.4.1 Brazil
- 5.5.4.2 Argentina
- 5.5.4.3 Rest of South America
- 5.5.5 Middle-East and Africa
- 5.5.5.1 Saudi Arabia
- 5.5.5.2 United Arab Emirates
- 5.5.5.3 South Africa
- 5.5.5.4 Egypt
- 5.5.5.5 Rest of Middle-East and Africa
- 5.5.1 Asia-Pacific
6 Competitive Landscape
- 6.1 Market Concentration
- 6.2 Strategic Moves
- 6.3 Market Share(%)/Ranking Analysis
- 6.4 Company Profiles (includes Global level Overview, Market level overview, Core Segments, Financials as available, Strategic Information, Market Rank/Share for key companies, Products and Services, and Recent Developments)
- 6.4.1 AandP Technology, Inc.
- 6.4.2 Anshan Senoda Carbon Fiber Co., Ltd.
- 6.4.3 DowAksa
- 6.4.4 Formosa Plastics Group
- 6.4.5 Hexcel Corporation
- 6.4.6 HS HYOSUNG ADVANCED MATERIALS
- 6.4.7 Jiangsu Hengshen Co.,Ltd
- 6.4.8 KUREHA CORPORATION
- 6.4.9 Mitsubishi Chemical Group Corporation
- 6.4.10 Nippon Graphite Fiber Co., Ltd.
- 6.4.11 Rock West Composites, Inc.
- 6.4.12 SGL Carbon
- 6.4.13 Sigmatex (UK) Limited
- 6.4.14 Solvay
- 6.4.15 Taekwang Industrial Co., Ltd.
- 6.4.16 Teijin Limited
- 6.4.17 TORAY INDUSTRIES, INC.
- 6.4.18 UMATEX
- 6.4.19 Zhongfu Shenying Carbon Fiber Co., Ltd.
7 Market Opportunities and Future Outlook
- 7.1 White-Space and Unmet-Need Assessment
- 7.2 Emphasis on Lignin-based Raw Materials for Carbon Fiber

